PYRAMID DISCOVERED IN INDONESIA TO HELP SATELLITE IMAGE, THE PYRAMID IS REALLY MORE THAN OLD PYRAMID IN EGYPT


Special Staff of President of Social Assistance and Natural Disasters Andi Arief said, in the village near Sadahurip Wanaradja Garut, West Java, was found buried in an ancient building.

Andi Arief explain ancient catastrophe teams have gained an overview of the building shapes such as pyramids, through satellite photos IFSAR, geoelectric, and various surveys.

Allegedly hidden life of the building is older than the Pyramids of Giza, Egypt. The team has researched ancient catastrophic intensive and test "carbon dating to estimate the age of the building.

"We are sure the building looks like a pyramid. Suspected there was a door to get into the building, we continue to do research, "said Andi Arief told INILAH.COM, Thursday (24/11/2011).

Just for the record, the Pyramids of Giza pyramid is known as the oldest and largest of the three pyramids of Giza Necropolis is on.

Ancient catastrophe team will continue to coordinate with the field of archeology, anthropology, archeology, cultural experts, historians and others. In addition, traffic will also continue to coordinate earth science with respect to the findings of the history of disasters locally and globally to look for mitigation.

Product Image Alos Palsar

ALOS satellite has been launched by the Japanese Space Agency in January 2006 and has managed to record the information surface of the earth. ALOS satellite carries three types of sensors, ie PALSAR, AVNIR-2, and Prism. Phased Array particular sensor type L-band Synthetic Aperture Radar (PALSAR) have the privilege can penetrate clouds, so the earth's surface information can be obtained at any time, both night and day. To high resolution mode and ScanSAR resolusion 10

meters and 100 meters. Detailed information on PALSAR sensor can be read like the table below. PALSAR data can be used for the manufacture of DEM, Interferometry for ground shift information, the content of biomass, monitoring of forestry, agriculture, oil spills (oil spill), soil moisture, mineral, search planes and ships are missing dll.


PALSAR is an active microwave sensor that works on the L band frequencies, where the sensor is an improved performance from the previous sensor, the JERS-1 SAR.


Hot Mud Volcano Sidoarjo Subsidence

The picture above is the result of ALOS PALSAR interferometry using high resolution image of the Lapindo mud volcano, Sidoarjo.

excess of the image of TERRA / ASTER

One of the advantages of the images TERRA / ASTER is a higher resolution than satellite imagery precursor and its class (eg, JERS-1 and Landsat). For example the comparison page, please see Figure 1 below
TERRA / ASTER
JERS-1 OPS
Landsat TM
Comparison of image resolution TERRA / ASTER satellite with its predecessor

These advantages can improve the accuracy of the analysis results by using this image. Some examples of application of the image of TERRA / ASTER for monitoring the earth's surface, for example in the field of mines, forestry and agriculture, are shown below.

A. Spectral characteristics of minerals and rocks
Indonesia has many natural resources, thus requiring separate handling for natural resource management process does not cause any negative effects or side effects of nature and the environment, especially against living things upon the exclusion of men. Well-planned treatment will produce good results as well though. Image of TERRA / ASTER is expected to provide assistance for the preparation of solution processing (mining) to post-mining process. The satellite imagery has 14 channels, each of which has its own function in the satellite image analysis. Figure 2 shows the sensitivity of each sensor in the TERRA / ASTER (VNIR, SWIR and TIR) of each type of minerals and rocks. Examples of its application to mapping based on the absorption spectral properties of clay minerals in the mining area south Escondida, Chile


Characteristics of each sensor in the satellite TERRA / ASTER

2. Classification of soil types
Image of TERRA / ASTER can also be used to map soil types, especially for agricultural purposes, especially for spatial planning and urban design. Figure 4 shows a comparison of the classical way of mapping the mapping by using the image of TERRA / ASTER


The results of the classification of soils in agricultural areas

3. Monitoring of volcanic activity
VNIR and SWIR sensors can be applied to determine the activity of the mountain, so the damage and casualties caused by natural disasters can be avoided or reduced. TIR sensors can be used to determine the distribution of heat emitted by the clouds of the mountain, where the sensor can be operated for the afternoon and evening. Figure 5 shows the results of analysis to determine the concentration of SO2 gas spewed by Mount Oyama, Miyake Island, Japan


SO2 gas density map (Mount Oyama on Miyake island, Japan)

4. Mapping vegetation in dry areas and wet
As with other Satellite (JERS-1 and Landsat), the image of TERRA / ASTER can also be used to map the distribution of plants in the earth's surface, especially for dry and wet areas using VNIR and SWIR sensors


The results of the classification of plants Kushiro, Hokkaido, Japan.

5. Monitoring of sea surface temperature
Sea surface temperature distribution can be obtained easily using the image of TERRA / ASTER, or directly by using the image of the TIR sensor. Application of this image can be used to determine the heat distribution of sea water, where this information can be applied to determine the oceanic phenomena, including the distribution of plants and fish.


Monitoring of sea surface temperatures around the bay of Tokyo (May 16, 2000)

6. Monitoring mangrove forest (mangrove)
The destruction of mangrove forests, either intentionally or effect of changing nature, can be detected using the image of TERRA / ASTER. Some of these satellite sensors have in common with the JERS-1 and Landsat, therefore a combination of satellite imagery may be used for monitoring mangrove forests and other forests. Figure 8 shows the results of monitoring up to 10 mangrove forest with a combination of satellite imagery in the area Can Giao, Vietnam from 1973 to 2002.


Study area of ​​mangrove forests in Can Giao, Vietnam by using a combination of Landsat satellite imagery / MSS, JERS-1 and TERRA / ASTER


Magnification image of the study area of ​​mangrove forest in Can Giao, Vietnam from 1989 to 2001


The observation

7. ASTER DEM products and ortho-Z
Satellite TERRA / ASTER can also result in the earth's surface elevation data (DEM) as an example in figure 11 which shows the results of the data that dioverlay DEM-Z with an optical image of Bandung and its surrounding areas.


Birds Eye London and surrounding areas

8. ASTER DEM-Z

The results of the optical image overlay with DEM-Z TERRA / ASTER (Mount Fuji, Japan).

9. Monitoring of forest fires
Figure 13 shows an example application of the image of TERRA / ASTER for monitoring forest fires in Cairns, Australia on December 25, 2001. Image of TERRA / ASTER can monitor forest fire area, where the coverage area VNIR produce fuel and cloud of smoke produced by fires they will be, SWIR shows the distribution of fuel temparature region, and the TIR shows the distribution of land burned by the intensity of land surface temperature of fuel. Red and blue in the figure shows the distribution of high and low temperatures.

Monitoring of forest fires in Cairns, Australia on December 25, 2001

10. Monitoring the temperature of the soil surface
Distribution of the earth's surface can be derived easily using data VNIR and TIR images TERRA / ASTER. Example of the decline is shown in Figure 14, where the left image shows the initial basis and the right picture tally. The application of this process can be used to determine the heating phenomena that occur in urban areas.

Analysis of land surface temperature around Mount Fuji, Japan.

11. Correlation DEM
DEM data derived from the images TERRA / ASTER (Level 1) can be obtained by the earth's surface contour information, which information can be applied to a wide range of fields, such as mining, power plants, dams or dam planning, flood prevention and others. Examples of software that can be used to create a DEM or ASTER images are TM of PCI Geomatics.

WAY GEOGRAPHIC SITUATION SAMPLE

LAND GEOGRAPHY REPORT Practicum
A. GEOGRAPHIC SITUATION SAMPLE
a. Taking the location of the Land
The location of the land is located in the Village District Karangjati Pandaan WordPress.
b. Place elevation
Karangjati the village including the village in the district that is located at an elevation Pandaan place 2-15 meters (BPS district Makati, 2008).
c. Vegetation Cover
Types of vegetation grow in the area of ​​the sample is a high-level trees, like mango, rambutan trees, and some dried plants are widely planted in front of the street and the front of houses.
d. Land forms
If seen by a morphologic, land form of the village district Karangjati Pandaan including landform denudasional because in some places there is a former erosion from areas of higher topography, the District Prigen.
e. Topography
Located on relatively flat slopes and slightly wavy, which is the area in the middle of WordPress. Slope height of between 6-91 meters.
f. According to the Köppen Climate types
Including climate type Aw / dry tropics with annual rainfall of 11.09 mm / day (BPS District. Pasuruan, 2008).
g. Parent rock (geology)
Based on information from data BPS Pasuruan (2008) regarding the geological conditions of the District of 500 Ha of land Pandaan vulcanik young quarter; 3677 the old quarter of Ha volcanic soil; 150 hectares of land plistosen sediments.
h. Land Use
Karangjati district land area. Pandaan Makati district are mostly used for industrial, residential and less for agriculture.

B. Practicum LAND
I. Soil density, and porosity Heavy Volume
A. Basic Theory
Soil type is a heavy weight of the soil in a unit volume of soil solids (gram/cm3). Weight of soil taken from the absolute dry weight (oven dry) land, so that the volume of soil solids obtained according to the law of Archimedes, which is an added volume of water after water incorporated into the soil. In this case the structure does not affect the texture and density.
Volume weight is the dry weight of a unit volume of soil in one piece. Dry weight is the weight of soil solids in absolutely dry conditions, but the volume of land used is the soil volume including pores space. Volume weight is determined by the amount of soil pore space (porosity) and soil solids, the greater the porosity, the smaller the volume weight.
Porosity of the soil is an index of relative pore volume, ie the ratio between pore volume (micro & macro) with the total volume. Porosity values ​​range from 30-60%.
Fine-textured soil will have a higher porosity than coarse-textured soils. According to the Hanafi (2005) that the weight content of the soil is a soil density per unit volume is expressed in the two following limits:
(1) The density of particles (particle weight = BP) is the weight of the mass of solid particles per unit volume of soil, soil typically has a particle density of 2.6 g cm-3, and
(2) The density of the mass (weight content = BI) is the weight of the land mass of field-dried condition ovenkan per unit volume.
Value of the land mass density is proportional to the level of roughness soil particles, the more rough will be more severe. Textured topsoil, clay and granular structure has a weight of contents (BI) of 1.0 g cm-3 up to 1.3 g cm-3, while the rough texture has a weight content of 1.3 g cm-3 up to 1.8 g cm-3.
2. Purpose
- Knowing the specific gravity, weight, volume and porosity of the soil
- Analyze the differences of the field results with existing theories
3. Tools and Materials

- Pumpkin measuring
- Scales
- + Refining a petri dish
- Pipette
- Mixer
- Soil samples
- Hot water
- Earth oven

4. Work steps
a. Retrieval of land with a ring coper, coper ring by planting on land to be used. In this case coper ring planting is done by the trampling feet, Lula dig around on the ground to take a coper ring which already contains the ground.
b. Mengoven ground for ± 48 hours, with temperatures up to 110 ° C
c. Heavy soil type of work the following steps:
A. Weigh flask
2. flask contents with earth oven that has been mashed and then weigh the total weight
3. add hot water up to a 100ml measure, then stir gently
4. measuring water in the flask.
d. Heavy volume and porosity:
A. Weigh coper ring + soil samples
2. Weigh the tube / paralon
3. paralon measure used
e. enter data
5. Measurement
No Land Information Nurul (Makati)
Pumpkin Measure 1 Weight 212.6 grams
2 Total Weight 283.7 grams
3 Heavy Soil = 283.7 to 212.6
= 71.1 grams
4 Volume Solids 30 cm3
5 The density of soil = 71.1 / 30
= 2.37 gr/cm3
6 Weight 44.5 grams of plastic gutter
7 Weight 107.9 grams of soil + paralon
8 dry weight of soil = 107.9 to 44.5
= 63.4 grams
9 The volume of soil = 3.14 x 1.152 x 9.8
= 40.7 cm3
10 Heavy volume = 63.4 / 40.7
= 1.56 gr/cm3
11 Porosity = 100 - (1.56 / 2.37 x100%)
= 34.2%

II. Handheld power and Permeability
A. Basic Theory
Permeability of a soil is the soil's ability to be able to drain the water in the soil profile, while the handheld is the soil's ability to withstand the loss of a substance in the soil.
Relationship with the Power Handheld Soil Texture, clay-textured soils have a greater surface area yasng so the ability to retain water and provide nutrients high. Fine-textured soils are more active in chemical reactions rather than coarse-textured soils. Sandy-textured soils have a smaller surface area so it is difficult to absorb (hold) water and nutrients.
2. Purpose
a. Know the size of the handheld and soil permeability
b. Analyze the factors that affect the permeability and the handheld.
3. Tools and Materials

- Transparent pipe
- Soil samples
- + Refining a petri dish
- Of cotton
- Gauze
- Rope
- The measuring cup
- Pipette
- Measuring tube

4. Work steps
- Smooth the soil samples that had previously been in the oven
- Put each sample of the transparent tube as high as 20 cm
a. Capillarity test
♦ the content as much as 100ml measuring cup, insert the tube which already contains the measuring cup into the soil samples.
♦ observe the rise of water in the tube per 5 minutes
b. Handheld Power Test
♦ fill the measuring cup with 100ml of water, pour into the tube until water is absorbed.
♦ wait until the water drips, record the time the first drop.
♦ waiting on the last droplet.
5. Measurement
a. Capillarity (from absorbed into the measuring cup)
type of soil
Time (minutes) Organic
(Cm) Sand
(Cm) Soil Nurul (Makati)
(Cm)
5 4,9 13 3
10 6.3 13.5 5.5
15 7.3 13.8 8.5
20 8.1 14 9.5
25 8.8 14.2 10.8
30 9.7 14.4 11.2
The remaining 86 ml Water 90 ml 78 ml

b. Handheld Power
Organic variable Nurul Sand (Makati)
A 10 cm 10 cm 10 cm
B 10.2 cm 10 cm 10.5 cm
C 1 min 49 sec 16 sec 24 min 12 sec
D 15min 15 sec 1 min 59 sec 59 min 2dtk
E 100ml 100ml 100ml
F 39 ml 58 ml 51 ml
G 38 ml 38 ml 9 ml
H 23 ml 4 ml 25 ml
I ³ 17.67 cm 18.02 cm 32.97 cm ³ ³
A 1.28 ml / cm ³ 0.23 ml / cm ³ 0.76 ml / cm ³

Description:

A. original high
B. high after a given water
C. When first trickle
D. last drop
E. original water
F. residual water in the tube
G. water dripping
H. handheld power (manual)
I. The volume of material (π.r2.t)
J. Handheld Power
H / I


C. DISCUSSION
I. Soil Conditions
Soil properties Nurul (Makati)
Light brown color
Sand texture with little clay
Crumb structure
Kinda hard consistency
Depth of 10 cm
Fertilization -
Taking Beaten ways to use a hammer and then dug up and taken the edge paralonnya
Low-lying state of geographical, vegetation trees Mango, papaya and grasses, the temperature of the hot, tropical climate

II. Soil density, and porosity Heavy Volume
a. Specific gravity
Conducted in the lab, specific gravity is 2.37 g/cm3 obtained which includes the mineral soil still contains organic material. The presence or absence of organic material can be seen from the land where the ground color of the District Pandaan Pasuruan have colors that tend to be more blackish brown. The brown color often occurs due to dissolution in the event of rain.
b. Heavy Volume
From this study, weight data obtained from the soil volume Pandaan Pasuruan District gr/cm3 as much as 1.56, which is included in the category of sandy soils (on the theory of gravity has sandy soil volume weight volume at 1.6 g/cm3). The volume weight is because in this land has somewhat crumb structure with larger pore spaces. In addition, organic matter content of soil also affects the weight of the soil volume.
This is evidenced by the high weight of the soil volume Pasuruan, because the soil contains little organic material Pasuruan. But in fact, similar to that land can still be used for planting crops that require a lot of organic content, because the soil samples were taken where the former urukan land development area so that there is a little more mixing of soil with sand.
c. Porosity
Porosity of a soil affected by soil texture, so the coarse-textured soil will have a porosity of less than bertesktur finely ground.
This is evidenced in pratikum, Pasuruan soil containing sand with little clay has a lower porosity.
III. Power handheld and Capillarity
a. Handheld Power
Sutau handheld power is determined by soil texture and porosity. Porosity is influenced by soil texture, affects the amount of hand-held power from the land.
- If there is dominance of the sand fraction, it will cause the formation of fewer macropores, so it touched the surface area of ​​materials to be narrow. Therefore, the handheld to the water to be very weak.
- If the dominance of the clay fraction formed many micro pores, then touch the surface area becomes very large. Therefore, the cell becomes large.
- If the dominance of the dust fraction of the meso pore formed in moderate amounts, the amount of the touch surface is wide enough. Therefore, a handheld power strong enough.
It can take a look at the comparison between ground pratikum Pasuruan, Sand and Organic Materials. The weakest hand-held power possessed by the sand. And ground water Pasuruan has greater power handheld.
In this experiment also the addition of Pasuruan high off the ground after being given water, which will expand if given water and shrink when heated.
b. Capillarity
Capillarity is the movement of water from the site berkadsar high to low water levels of the site due to higher energy retention (Pack Hanifa Ali, 2007). The presence of water in the soil can be an important component in the soil can be beneficial and detrimental kadangpula. Attraction between the water with colloidal clay causing several layers of water molecules attached to the surface of the colloidal clay is called a water adhesion. Adhesion strength of the bond can not be absorbed by the water causes the plant to crystallize aoleh.
Water-saturated soil can restrict air flow into the ground that it interferes with respiration and nutrient uptake by plant roots.
Oon research on capillarity test can prove the existence of capillarity / water absorption that occurs in both the soil type of sand, organiuk, and soil Pasuruan. Of the three soil water level changes that seep into the ground which is in the pipeline nodes. At the same time, among the three types of soil can be diperolreh the data on the type of sandy soil that has a speed higher capillarity than the soil type and soil organic Pasuruan.
Capillarity speed can be calculated every minute of the extra height, which in studies using the pause 5 menitan. Therefore, when the average speed of capillarity on the sandy soil is 0.14 cm / minute, while for organic soil data showed an average speed of 0, 2 cm / minute, while for the soil Pasuruan, 0.34 cm / minute.
So it can be concluded that the soil has the highest capillarity while the soil is sandy Pasuruan itself are a bit slow but heavy volume of research including the little sandy clay. This can be influenced by several factors, namely:
A. Possible accuracy in the lab is still less so for the detection of three types of soil kinera dal; bersammaan a very difficult time.
2. On the ground there Pasuruan clay content so it can affect the speed of soil capillarity.
From the capillarity test we can conclude the difference in speed between the three types of soil. In the capillary showed that the absorption rate is so large in the early minutes while seteklah about 20 minutes up the speed began to decrease. This proves the existence of saturation of the soil because most of the soil pore Ruan has filled with water so that the experience boredom.

D Conclusion
A. Based on the density of soil types soil weighs 2.37 Pasuruan gr/cm3, has a 1.56 Weight Volume gr/cm3 which includes a bit of clay and sand as much as 34.2% porosity which tegolong rough.
2. The test is based on hand-held ground Pasuruan has 0.76 ml / cm ³ with water stops dripping time at 24 minutes 12 seconds denganpenambahan height of 0.5 cm from the ground height of 10 cm and the initial amount of water remaining 75 ml of the initial 100 ml of water.
3. Pasuruan soil capillarity of 0.34 cm / min so because of the influence of the type of sand is mixed with a little clay content.

Carbon Monoxide in Pluto's atmosphere

Dwarf planet Pluto was discovered in 1930 and at that time considered as the smallest and farthest planet orbiting the Sun. In 2006, the IAU General Assembly in 2006, astronomers classify in terms of re-definition and define the planet Pluto a dwarf planet. This dwarf planet also had the privilege because of the other dwarf planets, he is the only one that has an atmosphere. Atmosphere at Pluto was discovered in 1988 when he dims the light of distant stars before Pluto passed in front of it or make a transit to the distant stars.

The latest results of observations of James Clerk Maxwell Telescope in Hawaii 15 meter signal looks strong carbon monoxide gas. Earlier, in Pluto's atmosphere is known to very thick and its thickness is estimated to reach lbih of 100 km. Recent data shows just the atmosphere on Pluto is much thicker again reached more than 3000 km, one-fourth the distance between Pluto and its largest satellite Charon. Gases in the atmosphere was unusually cold around -220 º Celsius and that was a surprise to astronomers is that they have caught the signal strength is more than 2 times the upper limit can yag in other research groups that you maintain a 30-meter IRAM telescope in Spain in 2000.

Changes in brightness over the last decade surprised the researchers. The data received showed that the size of Pluto's atmosphere in the carbon abundance monoksidanya grow or increase rapidly. Similar changes never seen before but only in the lowest layer of the atmosphere where the methane also appear to vary in thickness. Methane is another gas in Pluto that have been identified positively.

Carbon Monoxide and Pluto
In 1989, Pluto is at a distance closest to the Sun. Genesis is quite "rare" unusual considering aka Pluto takes 248 years to complete one orbit. Carbon monoxide gas is expected to be the result of solar heating of the surface of the ice which then evaporated during the period. Atmosphere that was formed among the most vulnerable in our solar system, given the uppermost layer of bubbles (bertamabah in size) to the space.

Menuru Dr. Christiane Helling from the University of St Andrews, the height of the carbon monoxide they see fit with the model of the solar wind strip Pluto's atmosphere.

Unlike the gas carbon dioxide, carbon monoxide acts as a coolant instead of methane as it absorbs sunlight and produces heat. The balance between these two gases are trace elements of nitrogen-dominated atmosphere, and very important in determining the fate of Pluto for a long season for decades. The new atmosphere of carbon monoxide was found to be an important key to slowing the rate of loss of atmosphere on Pluto. But, if the cooling effect is too large, the result will occur rain and snow throughout the nitrogen gas will freeze and fall to the surface.

According to Greaves, cold atmospheric conditions on Pluto who get the greatest influence on the heat generated from the sun can give important clues about how the basics of physics to work and become a case study for understanding the Earth's atmosphere.

NOAA SATELLITE TO FIGHT FOREST FIRES OF DISASTER

A. NOAA SATELLITE PROFILE
NOAA satellite earth station is a polar orbiting weather satellite, NOAA operates in LAPAN, Jakarta detect the entire surface of the earth. As a result, angle and direction of its orbit is not equal to the speed and direction of the turn of the earth. Satellites NOAA (National Oceanic Atmosferic Administration) operates at an altitude of 850 km above the earth's surface.
Satellite Meteorology NOAA satellite is the third generation's "National Oceanic and Atmospheric Administration" (NOAA) of USA. The emergence of these satellites to replace the previous generation of satellites, such as the series of TIROS (Television and Infra Red Observation Sattelite, years 1960-1965) and the series IOS (Infra Red Observation Sattelite, years 1970-1976). NOAA satellite configuration is at an altitude of 833-870 km orbit, inclination of about 98.7 ° - 98.9 °, have the sensing capability of an area of ​​2 x in 24 hours (day and night).

NOAA satellite is to obtain reliable information about the physical state of the sea / ocean and atmosphere. NOAA series is equipped with 6 (six) sensors, namely:
A. AVHRR (Advanced Very High Resolution Radiometer),
2. TOVS (TIROS Operational Vertical Sonde),
3. HIRS (High Resolution Infrared Sounder (part of the TOVS),
4. DCS (Data Collection System),
5. SEM (Space Environment Monitor),
6. SARSAT (Search And Rescue Sattelite System).

Between 6 (six) on the main sensor, the sensor is relevant to monitoring the Earth is AVHRR sensor with the ability to monitor the five channels starting from channel appears (visible band) through the channel far infrared (far infrared band). Period for one orbit for satellites NOAA is 102 minutes, so that every day approximately 14.1 mengasilkan orbit. Orbit numbers are not even caused a sub-orbital track is repeated daily on the line though at the time of recording the data does not change its local time in the latitude.
In general, AVHRR sensor has the following characteristics:
• The sensitivity of thermal infra-red channel at 300 K 0.12 K
• The number of pixels as many as 1024
• IFOV (Instantaneous Field of View) was 1.3 ± 0.1 rad m
• Resolution is the smallest at 1.1 x 1.1 km
• Wide coverage / sweep is 2590 km
• FOV (Field of View) is 55.4 °
• Speed-line (line rate) is 360 lines per minute
• Speed ​​of data (line data) is 665.4 x 10³ bps

AVHRR sensor consists of five channels (bands) with a specific wavelength. Based on the type of observation and the wavelength used by NOAA satellites can be seen in Table 1. below:

Table 1. Channel name, Wavelength, Spectrum and Type of Sensing
NOAA AVHRR Satellite Remote Sensor
Channel Wavelength (μm) Regional
Observations of the spectrum
A 0.56 to 0.68 Looks • albedo during the day, (the mapping of cloud)
• Monitoring of ice and snow weather
2 0.73 - 1:10
Looks to the near infrared
• Monitoring the development of plant
3 3.55 to 3.93 Infrared center • nighttime cloud mapping
• Measurement of surface temperature
• Distinguish between land and sea
• Monitoring of volcanic activity
• Monitoring the spread of volcanic dust
4 from 10.5 to 11.5 Infrared remote • day and night cloud mapping
• Measurements of sea surface temperature
• The study of ground water for agriculture
5 11.5 to 12.5 Infrared remote • Mapping of the day and night
• Measurements of sea surface temperature
• ground water and agricultural research

NOAA also has software that is known as NOM (NOAA Operations Manager) developed by the Environmental Sciences Department (ESD) at the NRI (Natural Resources Institute) based in the UK. The software is designed to be able to cope and adjust the problems in the system calendar and time on the computer that is caused by the millennium bug. NOM is a system that is different from previous systems, in which the Windows-based operating system.
The design of NOM can be used to:
• Provide a data merging, enabling the user or operator, is also an operational tool that can filter the data received by NOAA.
• NOM provides a common data export facilities and simple enough to be adapted to the software used for Geographical Information Systems (GIS) and image processing.
In operation, NOM is not a system that is used as a NOAA satellite data receiving device, or devices used for GIS applications, but only the software to process data from NOAA satellite imagery, in hopes of giving the results or output that the better.


B. USE SATELLITE NOAA
NOAA weather satellite is a satellite that serves to observe the environment and weather. These satellites are owned by the U.S. Department of Commerce, launched by the National Aeronautics and Space Administration (NASA) and is operated by the National Oceanic and Atmospheric Administration (NOAA). Indonesia is now in the atmosphere every day across the five series of NOAA, the NOAA-12, NOAA-14, NOAA-15, NOAA-16 and NOAA-17. NOAA satellite configuration is presented in the following figure:

Figure 2. The satellite configuration of NOAA (Jars, 1993)

AVHRR data from NOAA can be applied to analyze the parameters in the field of meteorology, oceanography, and hydrology. The combination use of multiple channels of data from AVHRR / NOAA can also be used for various applications, such as monitoring of vegetation, wildfires, albedo data extraction, data extraction temperature and sea surface temperature of land, agriculture, cloud coverage and the detection of snow / ice on the surface of the earth. In addition NOAA satellites are also used to monitor crop conditions in the United States, the influence of floods on agricultural crops in the Midwest in 1993 and early winter of 1995, severe drought in the wheat area in 1996, and late planting in 1996 in wheat production centers has been monitored using these data.
NOAA currently has the latest satellite series NOAA-N series with a code of ATN (Advanced TIROS-N) made by Lockheed Martin Space Systems Company (LMSSC). NOAA-N satellite has the following functions:
• Tools to monitor and analyze the image of the Earth's atmosphere, terrain, clouds, along with earth radiation, atmospheric ozone, aerosol dissemination, sea surface temperature, and temperature profiles along the water bertikal troposphere and stratosphere.
• Analyze the proton and electron fluxes at orbit altitude.
• Collection of data from the subject objectives.
• Search and Rescue Satellite-Aided Tracking (SARSAT) system.

C. STRENGTHS AND LACK OF SATELLITE NOAA
Pros:
A. Satellites NOAA (National Oceanic and Atmospheric Administration) can be used to monitor the state of the earth for the purpose of hydrology, oceanography and meteorology, including monitoring of forest fires.
2. Has a spatial resolution of 1100 x 1100 m with a very wide coverage and a series of NOAA polar meteorological satellites have very long operational history.
3. NOAA satellite detection geothermal geothermal properties that capture heat even though it was not because of the fires can also be monitored. During the day, NOAA will detect heat at 42o C temperature threshold, it is nighttime satellite capable of detecting heat threshold temperature at 37o C.
4. Processing of NOAA-AVHRR satellite imagery as a remote sensing satellite images with low spatial resolution and has the advantage that the daily temporal resolution. NOAA ground stations receive data from the AVHRR satellite raw data in a form known as a data HRPT (High Resolution Picture Transmission) on a regular basis 2-4 times / day. Therefore, the daily cycle of NOAA's good enough to observe changes in the ocean with a spatial resolution limited to 1.1 km. Image coverage broad enough to reach the 2399 km wide view on every global image is generated.
Disadvantages:
A. Conditions of use of NOAA-AVHRR satellites are highly dependent on the weather. Given the weakness of this satellite, it is necessary to combine this satellite with another satellite data to apply, so the estimate, which the region is closer to the actual fishing ground.
2. In general hotspot interpretation NOAA satellite has three sources of inaccuracy, namely (1) position (angle) as it passes by the NOAA satellite receiving station (2) The effects of the object surface of the earth to the NOAA satellite sensors such as surface water, a sandy barren land, the earth's surface containing relatively high metal (3) geometric correction of NOAA's image of itself.

D. PRODUCT OF SATELLITE NOAA
The following describes one application using NOAA satellites as a product. Indonesia is an archipelagic country is very large, has a vast sea waters to 5.9 million km2 and is very rich in biodiversity. One type of marine biodiversity that has a high economic value as an export commodity and widely spread in the waters of Indonesia.
In the future, the prospects for the development of fisheries Indonesia became one of the strategic and economic activities considered bright. It is also possible because of the changing behavior of the world community that experienced a shift in consumption patterns to fishery products and seafood. In addition, the limited ability of the world's supply of fish would make the fish as one of the strategic commodities of the world.
The main problems encountered in the utilization of marine fishery resources of Indonesia is difficult to determine the potential as a location for fishing (fishing ground). In general, fishermen in Indonesia are still using conventional methods, that only by using the five senses which is owned by the fishermen. Limitations of the senses in a suspected fishing ground of fishermen not only lead to inefficient use of fuel by 60% -70%, but also led to the concentration of fishing vessels in a specific location. As a result occurs in a particular area of ​​excessive exploitation (over fishing). If this is allowed to continue in a certain period sustainability of fishery resources will be disrupted, whereas in areas with considerable potential for fish just are not used optimally.
For that to be handled in a way that fishing activities to be effective, ie, by utilizing satellite data (NOAA) application of remote sensing data is currently available on the NOAA weather Indonesia.Satelit-USA that carry AVHRR sensors can also be used to assist the exploration marine resources. Satellite images produced can be analyzed and interpreted to determine the value and distribution of sea surface temperature in the water large enough to synoptic (covers all parts of Indonesia in just two consecutive tracks). Sea surface temperature is one indicator in determining the area of ​​fishing ground. The high frequency of observation (four track day) and operational costs are much cheaper when compared to other ways are the hallmarks of the utilization of remote sensing techniques.
Satellite observations will also be very useful for observation of oceanographic phenomena, especially upwelling and TEMPRATURE front which is an indicator of potential areas of high fish. Expected with the availability of such information will improve the effectiveness and efficiency of fishing in the sea.
NOAA is also a tool that supports the satellite microwave sensors that produce data of temperature, humidity, terrain and water. On a cloudy area on the sensor devices and infrared spectrum appears to have an unfavorable outcome.
Development of Earth Station Receiver Data NOAA / METOP

Data Processing System NOAA / METOP
 Hardware
PC or server with RAM and hard disk is large enough, Lancard, and Unix operating systems (linux).
 Software
Using a standard international module of AAPP EUMETSAT.
• NOAA Data Processing for the production of L1a, 1b, 1c, and 1d of the data input L0.
• Processing of data for the production of MetOp L1a, 1b, 1c, and 1d of the data input L0.
• Archiving of processed L1b data products, and L1d L1c.
 Product Release
• Display of data QL AVHRR (composite or BW), adjusted to the time of acquisition.
• Product level 0 refers to the NOAA HRPT HRPT NOAA standard level 0 which is compatible with AAPP module, and the products L0 Data MetOp.
• Products NOAA processed the data and data MetOp (L1b, L1c, L1d)

WebGIS on Google


With a background google maps, thematic maps are shown to be more easily identified in accordance with kondiri real in the field.
This application can also be easily modified as desired by the user's theme. WebGIS with Google on user more aware of our information in detail

intelligence Vehicle Tracking System (i-VTS)


Intelligence Vehicle Tracking System (i-VTS) is a system that allows an institution or individual to be able to control,
monitor and follow in the footsteps of all vehicles (object) in the geographic coordinate system (map) are online

WebGIS News & Information

WebGIS News & Information, Applications that present information maps (geographic) of the news presented in a portal or a site on-line.

WebGIS News & Information used to support applications (middleware) news or information presented in the site or portal that tekait directly into the data center (MediaCenter), such as news sites, media centers, knowledge centers and information service center

WebGIS Marketing

Marketing is a WebGIS decision support applications that present data and statistical analysis in the form of maps (geographic).
This can be a middleware application (application support) or a stand-alone associated with the service user database applications.

WebGIS Marketing can be used to: analisia statistics, product marketing, sales and business planning are presented in the form of intelligent maps on-line.

WebGIS SIMPOTENDA


WebGIS is Simpotenda Information Systems GIS-based Regional Potential *
(Geographic Information System) which is presented to support the implementation of e-Government. WebGIS Simpotenda present data seed potential areas as:
- Education
- Health
- Tourism
- Forestry
- Industry
- Economy & Trade
- Transportation & Transport
- Environment

Is also shown in Simpotenda administrative boundary maps, topographic maps and data on population.

WebGIS Simpotenda is part of the official website of the local government made ​​based GIS (map) so as to be easily accessible to the public and potential visitors / investors through the internet.

The advantages of this application are:
A. Data and geographic location of the associated potential for interactive
2. Spatial data (maps) are stored in the DBMS, so it can be added and modified online
3. Based on free software and open source, so the relatively low development costs

In the presentation of this application is supported by data, maps, work systems and the visual presentation system that is unique that distinguishes it from other applications.

Greening Planning Using IKONOS Satellite Imagery (Case Studies Wek Village II, North

Padangsidempuan District, City Padangsidempuan)
Urban area known as the hot atmosphere, because the city does not follow the layout rules and regulations for the planting of vegetation around settlements. Greening the city is the best alternative in creating an atmosphere of urban forest region, where in order to achieve its objectives and targets will require a focused and integrated plan that is by using Geographic Information System (GIS)-based computer by using IKONOS satellite imagery. IKONOS imagery Wek Village II, North Padangsidempuan District, City Padangsidempuan, dioverlay with digital maps

Padangsidempuan city administration and interpreted visually for objects and their coordinates are been verified through field checks (ground check). Based on the criteria - the criteria being used as a place worthy of greenery, there are 15 locations in the village of WEH II, North Padangsidempuan District, City of Padangsidempuan which can be used as the location of green that consists of major and minor roads, which form penghijauannya is the green line. IKONOS satellite imagery excess is located at a high spatial resolution (1x1 m), while its weakness lies in its economic value is quite expensive, so it can only be used by parties who have high purchasing value.

Landsat and Spot satellite images can help find the cause of flooding

Jurnalnet.com York: Landsat and Spot satellite images having high spatial and spectral resolution can help find the causes flooding, erosion and landslides in the watershed ecosystem (DAS).

"The two images are able to monitor changes in land use in the watershed ecosystem, for example due to illegal logging and mining of sand and stone quarrying in protected areas," said Prof Dr Gunawan Totok MS in inaugural speech Professor of Geography Faculty of the University of Gadjah Mada (UGM) in Yogyakarta, Thursday.

According to him, the role of Landsat and Spot satellite images ysang has advantages in spatial and spectral resolution assist in the provision of regional data in determining the location of Watershed Observer Station (SPAS) for monitoring floods, sediment, and waste, because of its ability to describe the character of the watershed ecosystem Digital.

"Management Information Systems (MIS) flood and drought that is supported by the use of Landsat and Spot satellite imagery can be used as an early warning system framework floods and droughts," said the man born in Klaten, January 3, 1951 it.

In addition, the integration of Landsat and Spot satellite imagery with geographic information systems (GIS) are able to map and make attractive display areas prone to floods and droughts, the symptoms of erosion, and landslides.

"By knowing the source of the flooding of land and sediment expected to be used as a basis for giving advice on which one supposed dihijaukan land as water catchment areas," he said.

Apart from Landsat and Spot satellite images, according to him, Ikonos and Quickbird satellite imagery having high temporal resolution is also capable of monitoring changes in land that is prevalent these days due to the conversion of land into housing in the suburbs as the cause of flooding.

Both satellite imagery that has a high spatial and temporal reslusi, so as to keep pace with changes in land within the period of weekly even daily.

"The integration of both the satellite imagery with GIS is able to determine where the location of the relatively long bridge and river bank erosion and monitoring areas prone to flood inundation and drought-prone, even areas prone to diseases related to environmental health," he said.

He argues, flood events that occurred in urban areas, such as Jakarta, Solo, Yogyakarta and Bandung due semenisasi yard and road pavement in the compound.

On the other hand, floods are common in coastal urban areas such as Jakarta and Semarang caused by a housing development on former swamp land, poor drainage, and frequent sea-level rise (rob).

He said the satellite imagery that could offset the speed of housing development in urban areas are quite tight and it is dynamic and Quickbird Ikonos satellite imagery.

"Through satellite imagery that can be mapped patterns of housing development and spatial distribution, so that the spatial-temporal predictable ecological areas which have high runoff discharge, which according to the basic structure and function of the space is actually a water catchment areas

Satellite-Satellite Geodesy, Geomatics Sector

satellite geodesy
IKONOS Satellite 3.1
Ikonos satellite is a high-resolution satellite operated by GeoEye. Its well-covered is a multispectral imaging with a resolution of 3.2 meters and near infrared (0.82 mm) panchromatic. Application to the mapping of natural resources and the urban hinterland, natural disaster analysis, forestry, agriculture, mining, construction, tax mapping and change detection. Relefan able to provide data for environmental studies. Ikonos provides an aerial view and satellite images to many places around the world.


Figure 3.1 IKONOS satellite in orbit; Sample Results IKONOS image

IKONOS Satellite Karaktreristik

No. Description of Characteristics
1 Release Date 24 September 1999 at Vandenberg Air Force Base, California, USA
2 Period of Operation 7 years
3 Orbit 98.1 degrees, sun synchronous
4 Speed ​​on Orbit 7.5 km / sec
5 speed 6.8 km above the earth / sec
6 speed 7.14 times around the Earth every 24 hours
7 Altitude 681 miles (Low Earth Orbit)
8 Resolution on Nadir 0.82 meter (panchromatic); 3.2 meters (multispectral)
9 Resolution 26 ° Off-Nadir 1.0 meter (panchromatic); 4.0 meters (multispectral)
10 Coverage of 11.3 kilometers at nadir image; 13.8 kilometers at 26 ° off-nadir
Equator Crossing Time 11 10:30 AM solar time
12 Cross Time Birthdays 3 days at 40 ° latitude
13 Channels panchromatic image, blue, green, red, near IR

QuickBird Satellite 3.2
QuickBird is a high-resolution satellite owned by DigitalGlobe. Operated directly by the company. Quickbird BGIS 2000 Sensor uses a sensor with a degree of detail resolution of 0.61 meters. Satellite imagery is an excellent resource in its use for environmental studies and analysis of land use change, agriculture, and forestry. In the industrial sector, satellite imagery can be used for exploration and production of oil / gas, construction engineering, and environmental studies.


Figure 3.2 QuickBird on orbit; QuickBird image in Taiwan after Typhoon Morakot; Satellite Image - Surabaya, Indonesia

QuickBird Satellite Karaktreristik

No. Description of Characteristics
1 Release Date 24 September 1999 at Vandenberg Air Force Base, California, USA
2 Aircraft Boeing Delta II launcher
3 Period of Operation 7 years
4 Orbit 97.2 °, sun synchronous
5 Speed ​​in Orbit 7.1 km / sec (25.560 km / h)
6 speed 6.8 km above the earth / sec
7 Accuracy 23 meters horizontal (CE90%)
8 The height of 450 kilometers
9 panchromatic resolution: 61 cm (nadir) to 72 cm (25 ° off-nadir)
Multi Spectral: 2:44 m (nadir) to 2.88 m (25 ° off-nadir))
10 Coverage Image 16.5 km x 16.5 km at nadir
11 Time 10:30 AM Crossing the Equator (descending node) solar time
12 Cross Time Birthdays 1-3.5 days, depending on latitude (30 ° off-nadir)
Image Pan Channel 13: 450-900 nm
Blue: 450-520 nm
Green: 520-600 nm
Red: 630-690 nm
Near IR: 760-900 nm

3.3 The satellite Landsat-7 ETM +
Landsat program began with the launch of Landsat-1 satellite. Landsat-1 is an earth observation satellite (EOS / Earth Observation Sattelite) The first, launched in 1972. This satellite is famous for its ability to record the earth's surface from space. The next generation of Landsat-1 satellite is Landsat-2, 3, 4, 5, and 7. At this time the Landsat-7 satellite-operated staple.
Landsat-7 launched on 15 April 1999. Landsat-7 is equipped with the Enhanced Thematic Mapper Plus (ETM +), which is a continuation of the program Thematic Mapper (TM) is carried from the Landsat-5. Channels on this satellite is basically the same as the 7 channels in TM, but expanded with the panchromatic channel 8. Channel 8 is a high resolution channel is an area of ​​15 meters.


Figure 3.3 Orbit Satellite Landsat-7 ETM +;
Color image of the town was actually Washington DC, Scanned from Landsat 7.


Karaktreristik satellite Landsat-7 ETM +

No. Description of Characteristics
1 Release Date 15 April 1999 at Vandenberg Air Force Base, California, USA
2 Orbit 705 + / - 5 km (at the equator) sun-synchronous
3 Orbit Inclination 98.2 + / - 0.15
4 Period of Orbit 98.9 minutes
5 Altitude 681 kilometers
6 Resolution on the Nadir 30x30 meter (TM), 120 mx 120 m pixel (far-infrared band / band 7)
7 The scope image 185 km (115 miles)
8 Equator Crossing Time 10:30 AM solar time
9 Time Traffic Birthday 16 days (233 orbits)
10 Channels panchromatic image, blue, green, red, near IR, middle IR, far IR, Thermal IR


3.4 ASTER satellite
ASTER satellite is a high-resolution satellites. ASTER was built by a consortium of Japanese government with a diverse group of researchers. ASTER monitoring of cloud cover, ice, land temperature, land use, natural disasters, sea ice, snow cover and vegetation patterns. This image has a spatial resolution of 15 to 90 meters. Multispectral imagery has 14 channels, which facilitate the analysis of objects with a wavelength that is invisible to the human eye as near IR, short wave IR, and Thermal official IR.Penyedia ASTER image is Sattelite Imaging Corporation (SIC) through the USGS.


Figure 3.4 Satellite ASTER; Image Structure Geology rocks in Yemen

ASTER satellite Karaktreristik

No. Description of Characteristics
1 Release Date 18 December 1999 at Vandenberg Air Force Base, California, USA
2 Orbit 705 km altitude, sun synchronous
3 Orbit Inclination 98.3 degrees from the equator
Orbit Period 4 98.88 minutes
5 Altitude 681 kilometers
6 Resolution on the Nadir 15 to 90 meters
7 Equator Crossing Time 10:30 AM solar time
8 Time Traffic Birthday 16 days


3.5 Satellite SPOT-5
Earth Observation satellite SPOT-5 successfully placed in orbit with the help of Ariane 4 rocket from the Guiana Space Center in Kourou on May 3, 2002. SPOT-5 satellite offers a good quality of satellite imagery, more cost effective to the needs of satellite imagery. Bias resolution capacity covers an area of ​​60 x 60 km or 60 km x 120 km in a double instrument. SPOT-5 satellite provides an ideal keseimbangn between high resolution and broad coverage of the image. SPOT-5 image results can be applied to medium-scale mapping (at 1:25 000 and 1:10 000) for rural and urban planning, oil and gas exploration and study management of a disaster.


Figure 3.5 Footprint satellites SPOT-5

SPOT-5 satellite Karaktreristik

No. Description of Characteristics
A launch date 3 May 2002 at Guiana Space Centre, Kourou, French Guyana
2 aircraft launcher Ariane 4
High Orbit 3 822 kilometers
4 Orbit Inclination 98.7 °, sun-synchronous
5 speed 7.4 km / second (26.640 km / hour)
6 10:30 AM equator passing time (descending node)
7 When the orbit of 101.4 minutes
8 Time cross over 2-3 days, depending on latitude
9 Coverage area 60 km x 60 km to 80 km at nadir
10 Metric Accuracy <50m horizontal position accuracy (CE90%) 11 Digitization 8 bits 12 Resolution Pan: 5m x 2.5m from 2 scenes Pan: 5m (nadir) MS: 10m (nadir) SWI: 20m (nadir) Image Pan Channel 13: 480-710 nm Green: 500-590 nm Red: 610-680 nm Near IR: 780-890 nm Shortwave IR: 1.580 to 1.750 nm 3.6 WorldView-2 Satellite DigitalGlobe's Worldview-2 satellite launched on 8Oktober 2009, the satellite is capable of producing images panchromatic (B & W) mono and stereo satellite image data up to 0.5 m. WorldView-2 can act like a paint brush, melakuakan multispectral data collection is fairly large area. Worldview-2 itself can cover an area of ​​nearly 1 million km2 per day, doubling the capacity of a collection of [the] [of whom I spoke,] map [we / us] to nearly 2 million km2 per day and is able to re-visit any place on earth in a , 1 day.


Figure 3.6 Satellite-2 WorldViem

WorldView-2 Satellite Karaktreristik
No. Description of Characteristics
A launch date October 8, 2009, Vandenberg Air Force Base
7920 Delta 2 launcher aircraft (nine strap-ons)
3 High orbit 770 kilometers
Sun synchronous orbit type 4, 10:30 am (LT) descending node
5 during the period of the orbit of 100 minutes; 7:25 year mission life
6 Satellite Dimensions 4.3 meters x 2.5 meters, 7.1 meters
Bands 7 panchromatic sensor
8 multispectral
8 Dynamic Range 11-bits per pixel
9 TimeDelayIntegration (TDI) panchromatic - 6 selectable levels from 8 to 64
Multispectral - 7 selectable levels from 3 to 24
10 Coverage of 16.4 kilometers at nadir image
11 Attitude Determination and Control 3-axis stabilized
Control Moment Gyros Actuators 12 (CMGS)
Sensors 13 Star trackers, solid state IRU
14 GPS Position Accuracy & Knowledge <500 meters at image start and stop
Acceleration Agility 16 1.5 deg / s / s
Rate: 3.5 deg / s
Time to slew 300 kilometers: 9 seconds

Why Can the Earth spinning / rotating

When we pushed the door, all the doors, both edges of the door and the door which is near the hinge, turning to take the same corner, during the same time interval. Examples of thrust angle for example, if we push the door, the edge of the door is moving faster (large v), while the doors are near the hinge, moving more slowly (small v). Well, every molecule in the cloud has its own power movement, every molecule in the cloud impulse itself, and when they come together, the greater the momentum. If the door stops spinning, all the doors were ikut2an stop rotating (angular velocity = 0). Although the linear velocity of each body part is different, the angular velocity of all the objects were always the same. The greater the mass of an object, the object is also the impetus large, which causes the solar nebula was rotating.

Energy defined angle L = m * w * r2 where m is the mass, w is the angular velocity in radians per second, and r is the radius of circular motion. Kemduain material solidifies and because it is attracted to the core rotation (inward) centers which then leads to the accumulation of a spherical planet. Solar nebula collapsed because of a supernova explosion which gave power terhantar shock through the cloud of cold molecular hydrogen. Of information is then due to the gravitational force then there is an accumulation (addition) are then united into physical planet. At the same planet, rotates as a result of panambahan material into one, as does the solar nebula.

Political geography

Political geography
Political geography is the study of the relation between life and political activity with the natural conditions of a State. Aspects contained in the Political Geography and Geography itself is such a wide geographical elements, the shape of the region, climate, resources and population.

a. According to Taylor 2000:783
Political Geography (political geography) who stressed that territorial interpreted as a fundamental relationship between the sovereignty of the country with a national homeland is located in the heart of the legitimacy and practice of modern nations. Where the results are analyzes of the region, with a space power focused on the state-centered
http://baehaqiarif.files.wordpress.com/2009/12/geografi.pdf

b. According to Friedrich Ratzel
Political geography emphasizes the connection between geographic physical factors with race - race at each - each country and its form of government ditentkan by nature. Understand the physical determinist.
Biological, Sri & Yani, Ahmad. , 2007. Political geography. New York: PT Refika Aditama

c. According to Otto Maul
Political geography is the doctrine of the landscape as a space of political life where the life of the country took place.
Hermawan, Iwan. , 2009. Geography An Introduction. New Delhi: Private Publishing

d. According to Richard Hennig
Geopolitics is a doctrine of power - political power in relation to the earth and its application in the future relation of the results obtained from studies conducted by the Political Geography.
Hermawan, Iwan. , 2009. Geography An Introduction. New Delhi: Private Publishing

e. According Hashofer
Administrative sciences in collaboration with territorial geography by taking into account the data to examine the formation of the country and its contents by the existing political power struggle. Geopolitics also pay attention to symptoms - symptoms of space activities in the political struggles within and in the arrangement.

Benefits S I G

The advantages of GIS:

Very efficient for a good map layers.
Quick to check and update.
Attribute data and maps easily manipulated by the sig.
Between the interactive map and the computer is in sig
does not require space to store the data it is most efficient for your time and place.
It easier to display the data kereana not have such a pile tympakan menncari eefisien map.
Capable of processing multiple data quickly and precisely with excellent quality as well.


Examples of the use of GIS:
Various symptoms in the present dpat geosphere quickly and accurately presented and bnyak manifold that can provide benefits for life. Therefore, information systems geogarafi dpat utilized in various fields:
Natural resources, including inventory, management of natural resources, kesesuan land for agriculture, plantations, Forestry, land use pernecaan tat, analaisis potential risk areas and the sea.
Areas of planning, including regional planning, settlement planning and site planning industry transmigrants
Arranging the data fields include the principal residence, penuediaan ifnormasi Sensu socioeconomic, election information systems and other
The military fields, including the provision of spatial data for the analysis of routes, logostik, war equipment and the tools to the needs of war and other games.
Education, including determining the location of education, information systems education / academic and other
GIS easily produce thematic maps
GIS can be split between the presentation and database
SIG has the ability to describe the elements that exist on the surface of the earth into a spatial data layer or coverage
GIS is very helpful work closely with the field of spatial and kaitanya geoinformatika.

Benefits of GIS:
Sig can provide geographical information completely and accurately.
Can make a decision on the issue of development.
Supporting the development plan ..
Monitoring of coast and sea.
Information potential of the village.
emantauan land use.
Transportation Sector: This function is used for large and medium-scale maps and spatial analysis, especially for transit route planning management, pengirimsn technicians, service analysis, marketing management and so on.
Mapping of natural resources

UNDERSTANDING AND FAR SENSING SYSTEMS GEOGRAPHY

A. Definition of Remote Sensing (Remote Sensing):
Here are the Senses much sense according to some experts
· Remote sensing (remote sensing), namely the use of radiation sensors record images elektromagnetikuntuk Earth's environment that can be interpreted sehinggamenghasilkan useful information (Curran, 1985).
· Remote Sensing (remote sensing) is the science and art of obtaining information about an object area, or phenomenon through the analysis of data obtained with an instrument without direct contact with the object, area, or phenomenon that were examined (Lillesand and Kiefer, 1998)
· Everett and Simonett (1976): Remote sensing is a science, because there is a certain systematic order to analyze the information from the earth's surface, this knowledge must be coordinated with several other scientific experts such as geology, soil, urban, and so forth.
· Remote sensing (remote sensing), which is a measurement or acquisition of data padaobjek on the surface of the earth from a satellite or other instrument in for much of the object yangdiindera (Colwell, 1984). Aerial photographs, satellite imagery and radar imagery is beberapabentuk remote sensing.
· Remote sensing (remote sensing), the science to get information about the Earth's surface such as land and water of the image obtained from a distance (Campbell, 1987). It is usually associated with the measurement of reflectance or emission of electromagnetic waves from an object.
· Remote sensing (remote sensing), namely, science and technology in the art of obtaining information about objects or phenomena in the (near) surface of the earth through the medium of recording objects or phenomena that harness energy from electromagnetic waves and achieve results in the form of image recording. (personal description)
2. Basic concepts of Remote Sensing (Remote Sensing)
The basic concept of remote sensing consists of several components including sources of energy, atmosphere, staff interaction with objects in the earth's surface, sensor, data processing system, and a variety of data usage
3. Benefits of Remote Sensing of the various disciplines:

A. FIELD OF FORESTRY
Forestry sector with respect to forest management for timber, including timber harvesting planning, monitoring, logging and reforestation, wildlife management and enumeration, inventory and monitoring of forest resources, recreation, and fire control. The physical condition of the forest is very susceptible to fire hazards is the use of infrared imagery would be very helpful in providing data and information in the context of continuous monitoring of temperature change with an adequate geographical aspects of the implementation on the ground that can be done very easily and quickly.
B. USE OF LAND
Inventory of land use is important to know whether the mapping of land by human activities in accordance with the potential or carrying capacity. Appropriate land use achieves good results, but gradually the results obtained will fall as the potential and carrying capacity of the land. Integration of remote sensing technology is one of the potential function guidance in the preparation of land use. Basic use of the land can be developed for various purposes of research, planning, and regional development. For example the use of land for agriculture or farming settlements.
C. MAKING THE MAP
Map image is the image that has been geographically referenced so it can be considered as a map. Spatial information presented in the map images are raster data derived from satellite imagery recording the results of natural resources continuously. Image maps provide all the information recorded on the earth without any generalization.
The role of the map image (map space) in the future will be essential in order to accelerate the availability of base maps and the determination of needs that are not yet able to cover the entire national territory on a global scale with the latest information (up to date). Image maps have the advantage of information on regular maps. This is because the image is a real picture of the earth's surface, while the regular maps and the selection is made based on generalizations or man-made landscapes. For example the base maps and soil maps.
D. FIELD OF METEOROLOGY (METEOSAT, TIROS, and NOAA)
Benefits of remote sensing in the field of meteorology is as follows.
a. Observe the climate of a region through the observation of virginity and the level of water content in the air.
b. Help weather analysis and forecasting / prediction by determining the area of ​​high pressure and low pressure as well as local storms and cyclones
mMengamati system / surface wind patterns.
d. Perform modeling of meteorological and climatological data sets.
E. FIELD Oceanography (SEASAT)
Benefits of remote sensing in the field of oceanography (marine) are as follows.
a. Observed physical properties of the sea, such as surface temperature, surface currents, and salinity of visible light (0-200 m).
b. Observing the ocean tides and waves (height, direction, and frequency).
c. Finding the location of upwelling, singking and distribution of surface temperature.
d. Study changes in the beach, erosion, and sedimentation (LANDSAT and SPOT).
F. Hydrological (LANDSAT / ERS, SPOT)
Benefits of remote sensing in hydrology is as follows.
a. Monitoring of watershed and river conservation.
b. Mapping of the river and river sedimentation studies.
c. Monitoring the intensity of the flood area.
G. FIELD SOLID EARTH GEOPHYSICS, Geology, geodesy, DANLINGKUNGAN (LANDSAT, GEOSAT)
Benefits of remote sensing in the field of geophysics, geology, and geodesy are as follows.
a. Mapping the surface, in addition to a photo shoot with the aircraft and using GIS applications.
b. Determine the geological structure and the kinds of rocks.
c. To monitor the disaster (fire), monitoring of volcanic activity, and monitoring the spread of volcanic dust
d. To monitor the distribution of natural resources such as forests (location, type, density, and destruction), minerals (uranium, gold, petroleum, and coal).
e. Monitoring of marine pollution and oil layers in the ocean.
f. Monitoring air pollution and marine pollution. (Dra. Sri Hartati Soenarmo MSP, 1993)

PROCESS OF volcano eruption

Volcanic eruption, magma caused by sediment in the bowels of the earth is pushed out by high-pressure gas. Of such eruptions of the volcano is formed. Eruptions of ash and rock that brought loud burst with radius as far as 18 km or more, being able to overwhelm the lava as far as 90 km radius. Volcanic eruptions can cause casualties and huge property to thousands of kilometers away and even bias affects the climate on earth is round. The results of volcanic eruptions (source: MPBI)

volcanic gas
Lava and flow of sand and hot rock
Lava
Landslide
Earthquake
Ash eruption
Hot clouds (pyroclastic)
Volcanic gases are gases released during volcanic eruptions that released carbon monoxide, among others, (CO), Carbondioksida (CO2), Hydrogen Sulfide (H2S), sulfur dioxide (SO2) and nitrogen (NO2) are dangerous to humans.

Lava is magma that high-temperature fluid flow to the surface through a volcanic crater. Liquid lava can flow away from the source follows the river or the valley while the thick lava flows not far from the source. Lava is one danger to society tingla on the slopes of the volcano. Is a flood of lava on the slopes Bandang consisting of a mixture of clay-sized material until volcanic boulders. Known as the lava eruptions and lava rain. Lava eruptions occur when a volcano that has erupted crater lake, so the lake water mixes with the hot material of the eruption, while the rain lava eruptions occur due to material mixing with rain water around the peak.
Hot clouds can form pyroclastic flows, pyroclastic blast and pyroclastic fall-out. Thermal cloud is a cloud of material flow eruption of hot, flowing down and finally settled in and around the river from the valley. Blowing hot cloud is a cloud of hot material a small eruption, blown by the wind speed reaches 90 km / h. Dropping the hot cloud is a cloud of hot material large and small eruption that was brought up by the power of a large eruption. Large material will fall around the peak, while the fine would fall in the tens, hundreds or even thousands of miles from the summit because of the influence of wind gusts. Hot clouds can cause burns to exposed body parts such as head, arms, neck or legs and also to not cause shortness of breath.


Volcanic ash is very fine material. Because the effects of wind can be felt hundreds of kilometers away. The impact of ash eruptions
Respiratory problems, vision problems, pollution of water sources, causing an electrical storm, disrupting work and motor vehicle engines, damaging the roof, damaging fields, damaging infrastructure. Preparations for Volcano Eruptions
identify local areas in determining a safe place to evacuate
disaster planning
prepare for evacuation if necessary
prepare the basic needs (food, clothing protective equipment)

In the event of Volcano Eruption
Avoid areas prone to disasters such as mountain slopes, canyons and lava flow area
In the open, protect themselves from ash and pyroclastic eruption
Prepare yourself for the possibility of follow-up disaster
Wear clothing that can protect the body, such as long sleeves, long pants, hats and other
Use eye protection such as goggles or other
Do not wear contact lenses
Wear a mask or cloth over the mouth and nose
Current pyroclastic fall try to cover her face with both hands.
In the aftermath of the Volcano Eruption
stay away from areas affected by ash falls
Clean the roof of Abu heap, because the weight can damage the ataun collapsed the roof of the building
Avoid driving in areas affected by ash fall because it can damage the engine, brakes, gears up to ignition.
This article comes from comic volcano, disaster prevention media created by IDEP Foundation with support from BAKORNAS PBP, CRS, MPBI, UNESCO, USAID and the people of Indonesia.

Geomorphology is the one piece of geography

Geomorphology is the one piece of geography. Where geomorphology which is a branch of geography, learning about the shape of the earth, which includes a broad view of the scope of the appearance of the landscape (landscape) to the smallest unit as a form of land (landform).
Landform system consists of mountains, hills, volcanic, karst, Alluvial, until the Marine Plain is formed by the influence of the constituent rocks at the bottom layer of the earth's surface.
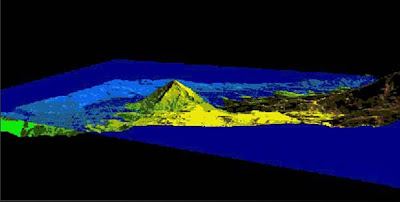
Observation and identification of landforms such as is done directly in the field by conducting field trips or can also be done with the interpretation of aerial photographs or Landsat Analysis (ACS). Remote sensing as a tool to monitor or observe objects without touching biumi face it directly, among other form of aerial photography or satellite imagery.
Landscape will be easily identified by sight distance or if using aerial photography or satellite imagery using a small-scale images. In contrast to the landscape easily observed at close range or with aerial photos or satellite imagery with a larger scale.
By observation and analysis of aerial photographs of land forms will other biophysical information obtained both as a fixed parameter (landform, rock, soil, slope) and the parameter changes (erosion, terrace, land use).

By doing fieldtrip will be more well known in the field of land forms, making it easy to remember it if ever seen in person and as a basis for memory at the time of aerial photo interpretation (IFU).
Forms of land even though easily observed by aerial photographs, but the approach needs to be done by doing come directly to the field in the form of field trips (field trip). It is intended to further ensure tersiri landform forming elements of the composition or arrangement of any rocks. Besides, the survey will be acquired lapangna fotro interpretation of several key air (IFU) of the results of field visits to various different land forms. So that would be obtained with IFU key analaisis a more complete form of land which is a constituent component of the landscape.
Complex form of the earth has become a subject of its own, especially in business usage. In this case any land formations have different capacities in an effort to support the use of which would lead to appropriate. So with the same goal which is intended to simplify the form of a complex land surface of this earth, then the understanding of the science of geomorphology to study land formations are very important.
Simplification of the complex face of the earth form a unit which has a similarity in the nature and perwatakannya. Unitary properties include geological or geomorphological structure similarity as the origin of its formation, geomorphological processes as giving information on how the land is formed, and topographical impression that will provide information about the configuration of the land surface. Given the information is appropriate land use planning will be further realized.

Until now the literature and maps on geomorphology Indonesia is still very little.
Existing maps, the area is very limited and small scale. While the map is
are needed as basic data to support development planning
a region.
Indonesia is currently only available in small-scale geomorphological map, which geomorphological map
Java by Pannekoek (1946) in the scale 1: 1,000,000. Then Verstappen
(1973), produced a geomorphological map of the island of Sumatra and the islands of the
surrounding the use of research utilizing image inderaan uh ja
a scale of 1: 2,500,000.
Several agencies in Indonesia, lately has been trying to make a map
geomorphology, but the emphasis the problem is still around generation (relief)
the earth's surface, while the process of its formation has not been disclosed in detail.
Since 1989, Center for Geology has mapped the geomorphology
using System ITC in 16 regions. Mapping resulted in 16 pieces
geomorphological map of the whole has been published in the scale 1: 100,000 (15 pieces)
and scale 1: 50,000 (1 sheet).
Given the above, the standard preparation of maps Geomorphology
is structured to generate a standard geomorphological map (default). System (method)
compilation system of ITC (International Institute for Aerospace Survey and
Earth Sciences) with a reference book entitled "Aerial Photo-Interpretation in
Terrain Analysis and Geomorphologic Mapping "(Van Zuidam, 1985). ITC system
selected and used as reference considering this system is a combination of
some existing systems, both in tropical, sub tropical, dry and slightly dry.
In the preparation of maps of geomorphology, the use and appearance factors need to be
consider, among other things:
a. Can be used for various types of terrain and flexible.
b. Can be used dlam various ways.
c. Simple and informative.
Intent and purpose of standardizing the preparation of maps of geomorphology is as
guidance in preparing geomorphological maps in Indonesia.

Prepared taking into account aspects of the terminology is often used in
maps and has a very distinctive name arranged alphabetically.
Landscape (landscape)
scenery composed by geomorphological elements in dimension
a wider range of terrain.
Forms of land (landform)
physical complex surface or near surface of the land
influenced by human activities.
Formation origin (morphologic origin)
landscape formation based on the genesis (mulajadi).
Denudation (denudation)
the process of stripping the earth's surface of the lid.
Geomorphological elements (geomorphologic element)
the smallest piece of land that have the same shape and form
genesanya.
Erosion (erosion)
series of processes that lead to a number of earth or rock material
eroded, transported and relocated elsewhere in the earth's surface.
Fluvial (fluvial)
activities that cause stream erosion, transport and
deposition of material on the surface of the earth.
Style endogenous (endogenous force)
power comes from within the earth that caused the movement,
fault, and vulkanisma perlipatan in the earth's surface.
Style exogenous (exogenous force)
energy from the outside world which leads to changes in
surface or near the earth's surface, such as weathering, erosion, abrasion, denudation.
Geomorphology (geomorphology)
is the science of the earth and its novel aspects
influence it.
Hogbek (hogkback)
ridge of hills or mountains with sharp peaks formed by
rock layers are hard and steep slopes.
Kars (karst)
shape the landscape caused by the intensification of the process of dissolving rock
limestone to form a distinctive landscape.
Kuesta (Cuesta)
hill or mountain that has two different slopes. Surface
slope of the ramps in line with the bedding area while the slopes
steep cut the bedding area.
Marin (marine)
activity of sea water which can cause abrasion, transport and
deposition in the marine environment.
Mesa (mesa)
isolated hill or mountain-shaped table, with the rest of the denudation
layers of flat rock hard as the lid.
Morfodinamis (morphodynamics)
landscape forms are strongly associated with the work style of exogenous water,
wind, ice and ground motion, eg sand dunes, river terraces, coastal embankment,
critical lands (Badlands).
Morfoerasi (morphoerosion)
are various forms of erosion that can be used as a measure of the degree of degradation
landform of an area.
Morfogenesa (morphogenesis)
landscape forms are classified based on mulajadi (genetic)
and development of landforms and the processes that happen to him.
Morphology (morphology)
the study of the shape the earth's surface.
Morfokonservasi (morphoconservation)
preservation of natural land forms based on the parameters.
Morfokronologi (morphochronology)
ties variety of land forms and processes.
Morphometry (morphometry)
quantitative aspects of the geomorphology of an area, eg, slope steepness, height,
terrain roughness.
Morfografi (morphography)
diskriptik geomorphological aspects of an area, eg, plains, hills, mountains,
plateau.
Morfostruktur active (active morphostructure)
landscape forms are strongly associated with the work style of the endogenous
dynamic, including volcanoes, tectonic (folds and faults), eg volcanoes,
ridge anticline and fault escarpment.
Morfostruktur passive (passive morphostructure)
form a landscape that is classified on the basis of rock type and structure
rocks that are related to denudation, eg mesa, kuesta, hogbek, and
dome.
Weathering (weathering)
the destruction of rock or mineral surface of the earth become a more
small or soft because of the physics, chemistry and biology.
Sectional geomorphology (geomorphologic cross section)
was sliced ​​up that reflect the landform configuration
landscape.
Land cover (land cover)
Anything that covers the surface of the earth, either natural or artificial.
Terrain (terrain)
form of surface or near the earth's surface that have physical characteristics
particular.

The process of forming WINDS BEHIND THE BENEFITS AND TORNADO TORNADO DISASTER

Wind TORNADO!


What is a Tornado / Putting a pickaxe?


Does Putting Tornado with a pickaxe, he replied yes, the difference is only in reference to the scale and intensity of the Tornado, Tornado in Indonesia known as angina or angina leysus putting pickaxe, which is different is the scale of intensity only, in Indonesia a little tornado danger

What is a tornado?

According to the Dictionary of Meteorology (AMS 2000), a tornado is "a rotating column of air with a loud, arise from cumuliform cloud or from the bottom of cumuliform cloud, and often (not always) looks like a funnel cloud." In other words, a vortex is classified as a tornado, to be connected with the ground and the cloud base. Meteorology experts have not found an easy way to classify and define tornadoes. For example, there is no clear distinction between mesosiklon (parent thunderstorm circulation) on the surface with a large weak tornado. It is known that the tornado funnel is not visible. Also, at what speed of the cloud to the surface of the tornado started.
How Tornado Formed?
What is a Tornado / Putting a pickaxe?

Does Putting Tornado with a pickaxe, he replied yes, the difference is only in reference to the scale and intensity of the Tornado, Tornado in Indonesia known as angina or angina leysus putting pickaxe, which is different is the scale of intensity only, in Indonesia a little tornado danger

What is a tornado?

According to the Dictionary of Meteorology (AMS 2000), a tornado is "a rotating column of air with a loud, arise from cumuliform cloud or from the bottom of cumuliform cloud, and often (not always) looks like a funnel cloud." In other words, a vortex is classified as a tornado, to be connected with the ground and the cloud base. Meteorology experts have not found an easy way to classify and define tornadoes. For example, there is no clear distinction between mesosiklon (parent thunderstorm circulation) on the surface with a large weak tornado. It is known that the tornado funnel is not visible. Also, at what speed of the cloud to the surface of the tornado started.
How Tornado Formed?


Most of the destructive and deadly tornadoes caused by Supercell, which are rotating thunderstorms with a regular circulation called mesosiklon. Supercell also can cause a destructive hail, high winds non-tornado, lightning, and sudden floods. Tornado formation can generally be seen on the things that happen on the storm scale, in and around mesosiklon. Tornado-related growth differences in temperature at the edge of the air masses down (downdraft) around mesosiklon (occlusion downdraft). Mathematical modeling studies of tornadoes growth also indicates a tornado can happen without such temperature patterns; even the reality, the observed temperature variation is very small in some of the tornado that caused severe damage in their history, on May 3, 1999.
From which direction a tornado comes?


· Can terjad anytime each year
· It can happen anywhere around the place in the world, but in the high latitude regions terjdinya usually in spring or summer
· In the United tornadoes can occur at 15 to 21 LT
· In Indonesia more bayank around Sumatra and Java (see table tornado frequency)

Does hail always happens before a tornado? Rain? Express?

Characteristics of rain, wind, lightning, and hail by observer varies from storm to storm one another, from hour to hour, and even the direction of movement of the storm. Large hail can indicate thunderstorms are not uncommon, and may occur before the tornado. Hail, or any other form of precipitation, lightning is not exactly going to happen tornado prediction.
Types of Tornadoes
Weak Tornado
Covers 88% of the total tornado
Cause of death is less than 5%
Have a grace period 1s.d> 10 min
Wind speeds less than 110 mph

Strong tornado
Covers 11% of the total incidence of tornadoes
Causing the death of nearly 30%
Has a duration of 20 minutes or even more
Have wind speeds of 205 mph 110 s.d


Tornado is very strong
Includes 1% of the total number of tornado events
Causing the death of nearly 70%
Have a duration exceeding 1 hour
Have wind speeds> 205 mph


How long lived tornado?
Tornadoes can last from a few seconds to over an hour. Most of the tornadoes last less than 10 minutes.

Benefits Tornado
Apparently behind dasyatnya tornado tornado saving benefit:
-Keep the temperature of the area through which the tornado. . . that the area is not too cold / hot because of the tornado brought winds of Regional else. . . which is usually from colder regions, more heat from the area hit by the wind
maybe if there is not much of a tornado into a desert and steppe Ice
many Latin American countries such as the desert due to no tornado

many countries like the United States into the field because there is no tornado Ice

Conclusion
- In Indonesia the term is called Tornado Wind Putting the wind picks or quail / captured or angina also Leysus
- The frequency of tornado occurrence in Putting out 2006 in Sumatra and Java are more frequent in November during the rainy season and into March when entering the dry season.
- Genesis hurricane or tornado winds Putting more often in the afternoon or evening