TRAINING MODULE DEVELOPMENT TRAINING INDEX KERETANAN BEACH Elevation Data Processing Module / Altitude TWO PARTS

10. On this page in the download file is ready, there are two ways to download a file,
ie download files individually or download all the files directly. on
this exercise we will download the file once  click the Download menu for
download

11. Next will be a process of rendering the data  after rendering the data
 complete directory then you will be asked penimpanan file / data download 
store the data according to your Desire


2. Wait for file storage process is completed  if the downloaded file is
complete, the download process or the completion of data acquisition

PHASE DATA PROCESSING
In the two DEM data processing software used to process
processing, namely the Global Mapper and ArcGIS 9.2 is dikengkapi with Hawths
Analysis Tools. In general there are several steps in the processing of DEM data, between
Another reading of the data, crooping data, extraction of data, reading data into ArcGIS, search
slope, Grid statisitk each cell, the integration of data into GIS. Complete the following steps in
data processing:
a. Reading of data
GDEM data (Global Digital Elevation Model) format downloaded from the internet "zip"
and consists of several files, to open the file and merge it used
Global Mapper software. Here are the steps the reading process,
merger, and the data in Global Mapper pengeksportan
A. Open the Global Mapper program that has been installed on your computer  Start 
Global Mapper program   Next, you'll go to the main page
Global Mapper as follows:

2. Open the file in a way GDEM  File  Open Data File (s)  locate the data file in the directory
storage of your data (D: \ @-IK-Training \ Module-7-DEM \ 1_Data_asli)  Select the file
you want to open it (press the CTRL key on your keyboard to select the data file is more than
a)  open  click menu click Yes All the time there is a warning window on the Global
Mapper  Wait a moment, then the file will open

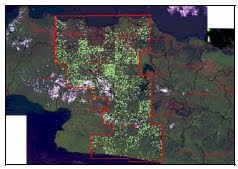
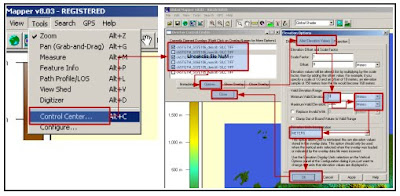
3. You will see GDEM file open, then there are some configuration
selection of data in a way  Select  Tools menu  Control Center Uncecklist all
file "NUM" because we're not using Option   click on the window Elevation
Alter Elevation Values ​​select Options make sure the units of meters   Minimum sure
Valid Elevation bernila zero   click OK and then click Close to close the menu
window

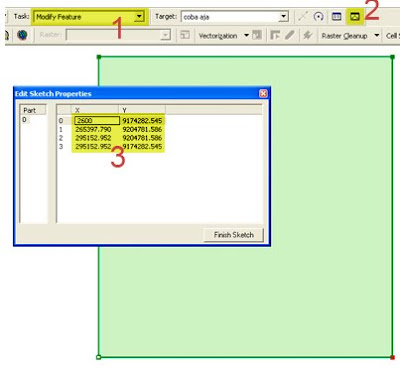
4. Once configuration is completed next export data according to region
Click the desired file   Export Raster and Elevation Data DEM  Export  on
DEM Export Options window select the menu  Export Bounds set the coordinates of the
you inginkkan, in this training we will download the Tangerang area with
boundary coordinates 106 345 BT - BT 106 767 and LS 5695 - 6:15 LS  save the file on
Your directory (D: \ @-IK-Training \ Module-7-DEM \ 3_Data_hasil_olahan) give the name of the file
to your liking  Wait for the export of up to 100%  export process
the data is complete


b. Analysis of Data in ArcGIS
ArcGIS program outcome data on exports in the analysis to determine the value of the slope
(slope) correspond to cells that have been made ​​in the previous exercise (module Introduction
GIS). Slope values ​​are taken (croop) just inside the cell, because the
one cell there are a lot of the slope, the next value in the same cell
are averaged to obtain one value in one cell. Step - a step
More as follows:
A. Open the ArcGIS program on your computer  Start  Programs  ArcGIS ArcMap  
set of projection systems with Geographical coordinates with datum WGS 1984
2. Before opening the DEM file from Global Mapper first activate the cell layer
that have been made ​​before, on this exercise I used the cell
tangerang by the number of cells 51. These cells will serve as the cutter
(crooper) slope values ​​that are within the cell. How to open a layer with
Click to Add Data   looking layer of cells on your computer directory, in the exercise
These cells are in the directory file D: \ @-IK-Training \ Module-7-DEM \ 2_Data_Peta \ cell  select
clip_elevasi_geo_tangerang.shp  click Add

3. After the active cell layer then open the DEM files exported from Global Mapper results
by means of data  Add  locate the file in your directory, in the exercise files
located in the directory D: \ @-IK-Training \ Module-7-DEM \ 3_Data_hasil_olahan  select file


4. The next step is to determine the value of the slope (slope) of the composite layer.
Before starting the determination of the slope of the analyst and make sure the 3D Toolbar
Hawth's tools in the active state  Select the menu View  Toolbars

5. Determination of the value of the slope ready to do the 3D Analyst menu  Select  Surface Analysis
 select Slope

6. Once the menu is selected slope you will go into the configuration menu  Ensure slope
input surface: gabungan.dem (or any other raster file)  select ouput mesurement
percent  Z factor: 0.00000899281  output cell size allow the default value  output
raster: save in the directory D: \ @-IK-Training \ Module-7-DEM \ 3_Data_hasil_olahan 
file name  click OK

Description:
 Ouput mesurement:  percent is a unit of the slope in
percent. The concept unit of percent on the slant is presented such as picture
the following:

 Z  factor is a unit adjustment factor, because the unit value of Z
(elevation) is then the meter must be adjusted to the system unit
coordinates is degrees. Z factor value is 1, assuming a value of 1
o
is 111.2 km then 1 meter equal to 0.00000899281
o
7. Wait a few moments to complete the process pemebentukan slope, after
process is finished slope will automatically appear as a new layer in the
ArcGIS as follows:

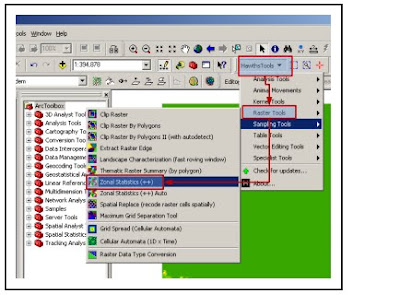
8. The next step is to take (crooping) which resides in the value of the slope
cells by using the Hawth's tools. This tool is capable of averaging the values ​​in
in the cell, so that in each cell just out of the slope. Select the menu
Hawth's tools  Tools  Zonal Statistics Raster (+ +)


9. Next, you will be asked to make choices in crooping value
 In the zonal slope of the polygon layer select a data cell that serves as a boundary
crooping (in this case we use the file clip_elevasi_geo_tangerang.shp)  on
select the raster layer slope (the slope of the layer formation process results)  select the output
table name in accordance with your wishes to save  Ok 

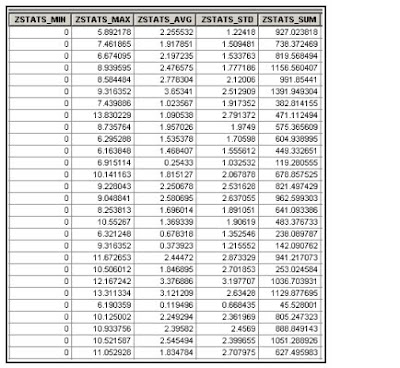
10. Wait a while until the process is complete crooping. When finished be sure
that the croping process successfully and have a logical value. Crooping results file
have the format "DBF" so that it can be seen directly with ArcGIS. The values
coming out of the crooping is a minimum value, maximum, average, standard
deviation, and the number in each cell, because the cells used amounted to 51 so
outgoing data lines are also numbered 51. In this training we just membutuhakan
the average value in each cell for the parameter determining coastal vulnerability index.
Here is an example of the output data crooping

c. Combining the data slope (slope) into the cell
The process of incorporation is the stage where the value of the slope (slope) is inserted
into the attributes of cells for GIS analysis. This process is quite easy because
just do a join table only. The steps are as follows:
A. Make sure the ArcGIS there are two active layers, the layer of cells
(clip_elevasi_geo_tangerang) and layer slope (crooping_slope)
2. Because at this training we just membutuhakan average value of the slope on
each cell then delete the values ​​that do not need, such as tilapia minimum, maximum,
standard deviation, and number. Removal steps are  right click
crooping_slope layer  open   active after the table right click on the header of data
 delete field

3. After the delete process is completed then the join table  do  ready click
Right on the layer clip_elevasi_geo_tangerang Join and Relates   select join

4. Next, you'll go to the menu options in the join table as
the following:

Adjust the options-increments as shown above
5. Table join process is completed  sample of the join is as follows:

TRAINING MODULE DEVELOPMENT TRAINING INDEX KERETANAN BEACH and Elevation Data Processing Module / Elevation PART ONE

One satau parameter in determining the elevation of coastal vulnerability index
or slope. The importance of information on coastal elevation data relating
to estimate inundation area face rising sea levels. by knowing the
elevation information of an area it can be estimated well and the wide range of land
to be inundated due to sea level rise looks at each particular hike,
locations to determine areas prone to inundation.
There are many ways in the present elevation of the earth's surface in the form
Digital. One way to present the earth's surface with storage
limited capacity is a Digital Elevation Model (DEM). DEM is
one model to describe the shape of the earth surface topography that can
visualized in 3D (three dimensional). There are many ways to obtain
DEM data, interferometry SAR (Synthetic Aperture Radar) is one of the algorithms
to make a relatively new DEM data. SAR image data or a radar image
used in the process of interferometry can be obtained from satellite or airplane rides,
apart from the radar DEM can also be obtained from the ASTER image. In this training DEM data
which will be used for the GDEM (Global Digital Elevation Model) derived from satellite
ASTER (Advanced Spaceborne Thermal Emission and Reflection Radiometer). GDEM
have ketilitian (spatial resolution) are pretty good that is 30 meters, while
coverage area is nearly the entire surface of the earth is covered in the data GDEM. data
GDEM can be downloaded (download) for free on the internet through the website
http://www.gdem.aster.ersdac.or.jp, which issued the data format is TIF (Tag Image
Format) which can be opened directly diperangkat GIS software, making it easier for
needs further analysis

DATA ACQUISITION PHASE (DOWNLOAD)
In general, the process of downloading the data, there are three main stages to be passed,
the registration as a member, select the desired area, the latter is
download the data. in detail here are the steps in the process
download data:
A. Type the website address into the address bar http://www.gdem.aster.ersdac.or.jp
browser, in which case we are using Mozilla Firefox, then press enter


2. If your computer is connected to the internet it will show a web page
as follows:


3. Click on register & modification to register  then you will fit in
form filling of personal data

4. Fill the form in accordance with his orders, which marked with an asterisk (*) is
sign a required field command  After filling the form is complete click the menu button
Next  if the registration is successful then you will return to the main page and
means that the registration was successful, and your user name will be printed on the left
top right corner

5. Then click the Search menu to start your search DEM data  you will go
to map the following page

6. With the help of a computer mouse to enlarge the area you want
download  in this case we will enlarge the area tangerang

7. Before the download of data you must first choose a location where
Just that you will donwload  Select tiles directly select menu and then click the menu 
Start  then the cursor will change shape like a plus sign (plus) next 
Click the area you want, in this case we choose the Tangerang

8. Once you selected the location  Next  then click menu then the data will
display and ready for dowload


9. Once the data is in the download is performed  Click Next to enter the menu
agreement page  Select purpose choose the menu Climate (as needed
you)   Agree then click menu then you will go to the download page

ANALYSIS SRTM DEM accuracy DISTRICT LEVEL DATA MOUNTAIN WEST JAVA SALAK BANDUNG


Information cover / land use derived from Landsat-7 imagery created by LAPAN, while the elevation data obtained from the RAN and is used as a reference. Because it is used as a reference it is assumed that the accuracy of the height of the topographical map 1:25.000 scale better than the accuracy of height-SRTM DEM data.
Areas that are used as research samples (Figure 1) is part of West Java region representing a variety of heights and types of cover / land use. The studied region covers an area of ​​Tangerang, Jakarta, Jakarta, to the south to the coastal district Cianjur.
1.2. Cover / land use in West Java
Cover / land use that are used are made from interpretation of Landsat satellite imagery from 2002-2003 made ​​by Pusbangja on the inventory of natural resources in 2004, the interpretation done on a scale of 1:100,000 mapping. Figure 2 below shows the information cover / land use in West Java.


2. RESEARCH METHODOLOGY
The first is the extraction of the position / location and the high point of the scale topographical map 1:25.000 with a way to scan the map into data jpeg, jpeg then the data scanned so as to have corrected the geometry of geographic coordinates and stored in a format ECw. From the data of the geometry correction is done deleniasi / high point for the identification of the point obtained geographic coordinates and altitude information at that point. The position coordinates with the data obtained dioverlay cover / land use and SRTM DEM data so that each position coordinates of the real has information height (from the data map form of the earth), the type of land cover, and elevation of the SRTM DEM data.
Areas studied were divided into 2 parts (left and right parts) (Fig. 3). The results of statistical analysis of the first region to be a comparison / control statistical analysis of the results of section 2. By comparing statistics obtained from the two regions will be known how far the influence of differences in land cover to the value of height-SRTM DEM data.
Coordinate information of each position are grouped by type of land cover. Land cover classes used were forests, plantations, groves, open land, farm / moor, ponds, irrigated fields, villages, and cities.
Once grouped by land cover units for each observed position coordinates of the high points of information obtained from topographical maps and SRTM DEM of the data compared, and the statistics are made about the height difference (mean difference and the deviation of the difference). By knowing the average difference and the deviation of the difference it will be known how much precision measurement of the height of the SRTM DEM dipeleh of the data.


3. RESULTS AND DISCUSSION
Overlay geographical coordinates of points that contains the height information from topographical maps, the DEM-SRTM, and type of cover / land use can be seen in Figure 4. In the table overlay results are presented in Table 1.
From Table 1 performed grouping data based on land cover, each group statistical difference measurement computed data. Table 2 shows the statistical results of the measurement differences between the SRTM-DEM data with topographical elevation data for the region to the right.

Topographic-and SRTM DEM about 15 meters, this suggests that the results of measurements of the height-SRTM DEM is 15 meters higher than the topographical elevation data, this difference is caused by the height of forest land and plantations cover an average of 15 meters. The object being measured height of the DEM data is the surface cover or canopy of the forest or plantation while measured by the topographical map is the height from ground level. Differences in the measured object from the data (DEM and rpbm) requires that the height calibration, data-SRTM DEM needs to be calibrated or decreased in value based on the height of land cover.
To groves and fields of land cover / dry shown by Table 2, the measurement height of 3-4 meter DEM data is higher. As an explanation for the forests and plantations due to the above then this is the average height of shrub land cover and farm / moor is 3 to 4 meters. As for the other land cover farms, open land, fields, villages and urban land cover in the absence of a significant elevation caused by measurement of the relative SRTM DEM data, together with topographical height of the data. Object of the water body is not included in the analysis because of the height of the water body is calculated in the algorithm fails interferometry (discontinew).
Accuracy of measurements taken from SRTM DEM data, indicated by the standard

deviation of the difference measurement. For forests and plantations standard deviation values ​​of table 2 is about 13 meters, this means that the height measurement accuracy of the data-SRTM DEM is 13 meters. Measurement error of 13 meters is caused by variations in elevation than the land cover of forest or plantation is also caused by internal errors of the SRTM-DEM data.
Precision measurement of the height of the paddy fields and ponds around 1-2 meters, due to variations in land cover ponds and rice fields almost no (<1 meter), then the measurement error of 1-2 meters of paddy fields and ponds due to internal error-SRTM DEM data itself.
In general, that the data-SRTM DEM has two kinds of errors, the first error caused by variations in the height of land cover and the second error of the system that produces a data-SRTM DEM (internal error). From Table 2 and described above then the measurement error resulting from the production system-SRTM DEM data ranges from 2 meters, while the other error resulting from land cover types.
Table 3 shows the results of measuring the difference between statitik-SRTM DEM data with topographical elevation data for the region to the left.

On the left side of the average height of forest and plantation areas is lower than the right. In contrast to the region on the right side where the altitude forests and plantations are the same then the average height of the plantations in this region is lower than the forest. Keteltian level height in forest cover on the right (12 meters) higher than the precision on the left (18 meters).
From the analysis of Table 2 and Table 3 above turns out that the accuracy of different heights to the left and right, the average difference in elevation for each land use in the second part is also different. There are two similarities of the two tables above, the first is that the higher elevation land covers the measurement of the average difference between the SRTM-DEM data with greater topographical elevation data, the higher the variation in the value of the land cover greater heights so that the level of accuracy to be lower third measurement accuracy of the DEM-SRTM elevation is below 20 meters, whereas if the forests did not exist then the measurement accuracy to below 13 meters, while for paddy fields, ponds had the highest ketelitin is under 3 meters.

4. CONCLUSION
The conclusion of this study are:
- Land cover affect the accuracy of measurement data, the SRTM DEM
- Value-SRTM DEM on land with a high elevation (forest plantations) need to do calibration
(reduction).
- The measurement accuracy depends on the SRTM DEM, land cover, forest land where the lowest
measurement accuracy, while in the fishponds, the highest measurement accuracy sawa.
- The level of measurement error-SRTM DEM data are generally below 20 meters

5. ADVICE
The use of SRTM-DEM data for mapping purposes should consider the mapped region, if the area is generally mapped wetland, the SRTM DEM data can be used for large-scale mapping
greater, whereas if the hills where most of the forest land cover data usage SRTM DEM-scale maps are used to lower

LIMITATIONS OR DISASTER MITIGATION frustration?


The two key words rather just posted to probe further the idea of ​​disaster management which is run in one district in the western part of a province in Sumatra Island's famous coffee. There is a fact that intrigued me when splitting the hills there. There is a tremendous project to secure the hills there, aka miscarriage of landslide disaster area. The hills there made "tie legs".
Tie the legs is a term that I chose. Let's look at the photos I got on the field. If we assume a hill as a private figure like a man then of course there is the position of the belt in a belt worth mentioning. The belt is better suited for so-called connective feet foot binding function. And what is interesting to ditelisik? The answer is the idea of ​​making the leg tie.
Some years we get education about land erosion through many media. Erosion-landslide that occurred in Indonesia land move stakeholders with an interest in the world to deliver something for the sake of common security. And of course the intended target. So I was confident to invite readers to review the discussion this time without in-depth intro.
There is an important factor triggering the occurrence of land slides that seemed neglected in disaster mitigation project nesting. Trigger landslides in the form of land not only deforestation in the hinterland. In fact, if we are careful even then we may be widened. For, though dense forest area will not guarantee free land slides. Forest entity has an actual mass at a certain point of climax would be a burden to sustain yag land. Last factor is what I mean? Factor is the area of ​​slip!
It is not true assumption that the layer of soil or rock that make up the Earth's surface is located on flat water as well as parallel stacked. I describe these Kekurangpemahaman Juka will look like this.


We need to recall that there are two workers who work on the earth's surface. Tersebutlah forces that shape Earth's surface configuration. The result is the formation of hills, valleys, and so forth. The labor force is generally specified as endogenous and exogenous. So we must always realize that the layers of soil and rock is very diverse. Variety is related to the position, direction, combination, and slope.
An understanding of variations in the configuration of the earth's surface layer should lead us to an issue critical to the land. The field is a field that limits the sliding element 2 layers of different characters. Eg soil layer above the layer of volcanic rock is hard and slippery. The field of slip becomes important to observe because it's a case of conditions (different characters) ketidakkompakan impact on these elements. If compactness is not guaranteed then keterceraiberaian just a matter of time. In the volcanic soil and rock samples, increasing the risk of land slides in the event of heavy rain so the water soak into the ground until contact with volcanic rocks that nature is hard and slippery. At the time it accumulates, the water will seep-water collects in the rocks so as to make ground contact to be similar to the slippery clay. When the gravity of the soil mass is no longer tolerated by the frictional forces between the soil and rock layers of the soil then it will automatically slide. There was erosion of land.
Tie legs Has built in the district beyond these considerations? For high-alias width is not specifically tied his legs if need be assigned to secure areas of slip earlier. The first time I saw my tie is straight leg believes that these efforts will contribute to satisfy the no anticipation about the disaster. My belief is immediately evident on the spot. In another point of land landslide buried up to tie the legs and at other points developed a model that looks more like leg tie belt. Perhaps the intangible belt pile of stone cliffs were developed after the tie was unable to maintain the stability of the foot point. Even if there is a plan to raise the long-leg tie a headband belt until it is necessary to think over what exactly will be the area. Are all the hills will be transformed into bread covered with cement? The idea of ​​disaster mitigation as a result frustrations or limitations?

MAKE A polygon with COORDINATES ARE ALREADY SPECIFIED LIMIT


I was inspired office colleagues who have problems when having to make a polygon with the coordinates of box corners / edges of each polygon that has been determined. I was attracted to the rip off such problems and in less than 5 minutes, with the help of ArcGIS, I found a simple way. The way it departs from the logic that the computer or GIS software is actually always store the coordinates of each corner polygon description. If I can find how to open the attribute that contains the coordinates of the course there is a chance I can to reshape a polygon into a new polygon in accordance with the wishes. This desire is to create a polygon with a specified limit.
I simply just making arbitrary polygon. Then I turn on its editing feature. Then select the Task: Modify Feature (1). Polygons were raised vertex / point in each corner. In other words, these polygons have been ready to accept modifications.
The second step is to activate the Sketch Properties (2). Emerged a new window that displays tabular coordinates are recorded for each point on the polygon. This tabular value that is ready to be replaced (3). The last execution by Finish Sketch. Polygons have been "pulled" into the position we want. Very practical and simple. This step generates a polygon as generated COG

ILWIS pixel value IN SOFTWARE AND SOMETIMES NOT LIKE DIFFERENT EXPECTATIONS?

Often I get asked which is actually just the beginning of complaints from friends. They complain why the satellite imagery used to be represented by a value between 0-255 (8 bits) in the software ILWIS it represented a value outside that range. I then rushed him to see the domain system in its properties (right-click the file "Map" and select "Properties"). Please note the pull-down menu selected in the field "Domain". If the folder is opened a satellite image of the domain is generally required is "IMAGE".
There are a variety of domains to open various file formats on the ILWIS software. It should be noted here that the different domain with a domain that I cover in the post about the webblog / internet. To introduce or just to remind those who forgot, I wrote the following domains range in ILWIS (I quote from ILWIS Additional Help).

VALUE. Domain system is used generally to calculate.
DISTANCE. Domain system is designed to calculate the distance. Fair meter units used.
COUNT. Domain system is designed to calculate the value undefined.
MIN1TO1. Domain system is designed to calculate a value between -1.00 to +1.00.
NILTO1. Domain system is designed to calculate a value between 0.00 to +1.00.
PERC. Domain system is designed to calculate the percent.
BYTE. This domain system to calculate the image that has a value between 0 to 255 where 0 meant no undefined.
IMAGE. This domain system for image with integer values ​​between 0-255.
NOAA. This domain system to image with an integer value between 0-1023.
RADAR. This domain system for radar image that has an integer value between 0-32767.
BOOL. This domain system for calculating a boolean value: True, False, and undefined.
Yesno. This domain system for calculating a boolean value: Yes, No, and undefined.
BIT. Domain system is used to calculate a value between 0 and 1.
STRING. Domain system is used for the column that contains text such as descriptions.
UniqueID. Domain system is used to map where each mapping unit is expected to obtain a unique ID.
COLOR. Domain system is used for color images (256 × 256 × 256 colors).
COLORCMP. Domain system is used as an output color pengompositan operation.
FlowDirection. Domain system is used to calculate the eight cardinal directions. Domain output Flow direction is useful for operations on ILWIS.
NONE. Domain system is used for tables that do not have a class or ID domain.

I hope these quotes help!
* Author, Febrio Sapta Widyatmaka, S.Si
Often I get asked which is actually just the beginning of complaints from friends. They complain why the satellite imagery used to be represented by a value between 0-255 (8 bits) in the software ILWIS it represented a value outside that range. I then rushed him to see the domain system in its properties (right-click the file "Map" and select "Properties"). Please note the pull-down menu selected in the field "Domain". If the folder is opened a satellite image of the domain is generally required is "IMAGE".
There are a variety of domains to open various file formats on the ILWIS software. It should be noted here that the different domain with a domain that I cover in the post about the webblog / internet. To introduce or just to remind those who forgot, I wrote the following domains range in ILWIS (I quote from ILWIS Additional Help) .
1. VALUE. Domain system is used generally to mengkalkulasi.
2. DISTANCE. Domain system is designed to calculate the distance. A unit used meter.
3 fair. COUNT. Domain system is designed to calculate the value that is not terdefinisikan.
4. MIN1TO1. Domain system is designed to calculate a value between -1.00 to +1,00.
5. NILTO1. Domain system is designed to calculate a value between 0.00 to +1,00.
6. PERC. Domain system is designed to calculate the value persen.
7. BYTE. This domain system to calculate the image that has a value between 0 to 255 where 0
meant no terdefinisi.
8. IMAGE. This domain system for image with integer values ​​between 0-255.
9. NOAA. This domain system for image with integer values ​​between 0-1.023.
10. RADAR. This domain system for radar images that have integer values ​​between 0-32.767.
11. BOOL. This domain system for calculating a boolean value: True, False, and undefined.
12. Yesno. This domain system for calculating a boolean value: Yes, No, and undefined.
13. BIT. Domain system is used to calculate a value between 0 and 1.
14. STRING. Domain system is used for the column that contains text such as deskripsi.
15. UniqueID. Domain system is used to map where each unit is expected to obtain ID unik.
16 mapping. COLOR. Domain system is used for color images (256 × 256 × 256 colors) .
17. COLORCMP. Domain system is used as an operation output pengompositan warna.
18. FlowDirection. Domain system is used to calculate the eight cardinal directions. Domain output is useful for operations on ILWIS.
19 Flow direction. NONE. Domain system is used for tables that do not have a class or ID domain.

Creating Maps with ArcView

On this bright morning, sharing geospatial want to share about "How to Make Maps with GIS software ArcView GIS in this case" for Mechanical Input Data.

Looking at developments that PETA is no longer owned by the Master of a ship about to sail and use the MAP as navigation, PETA also not only belong to my friends who studied geography, geodesy, spatial planning, PETA is also no longer belongs to STATE, the trend is now turning that MAP PUBLIC property. Especially the emergence of Google Earth, Google Maps, and others that make the eyes of the world community will open the fun of knowing and seeing the sites in the world and where he lived alone on the latitude and longitude coordinates. Especially the look more interesting with the background of satellite imagery from local to global scale, building his house to look at the tree near the house.

Neither of the above makes the campaigners trying to map the world, starting from his home environment mapping, mapping problems and the various phenomena that occur in this beloved earth. Thus was born the "neo-geographers", my friends are using his maps as tools to map, analyze, present and distribute as well as generate kesadarana surrounding communities to care about and think globally. Mapping becomes more attractive and is no longer something exclusive, PETA is now owned by PUBLIC, from small children can shout MAP-MAP, to the villagers knew and asked where the location of your home, try to look at PETA.

Back again to the laptop ... uuuppsss, that technology is making increasingly helped by the emerging MAP and development of computer technology. Hardware, software growing from time to time as fast as fast as the faster raster and precision manufacturing help PETA vector exactly as the corrector.

What is interesting also that the SIG, is no longer just have to be akantetapi SYSTEM SCIENCE ... Geographical Information Science.

In a system, GIS (Geographical Information System) has been barangtentu are: INPUT is the beginning when we would walk in them. An electronic book or ebook GIS titled "Introduction to ArcView GIS Mapping: Technical Input Data" in the geospatial-sharing within the GIS community to try to take us know early on Mapping Mapping or English.

View is more in the ebook to open it and there is a more interesting title of "Mapping with ArcView GIS for Forest Fire Control Management". Lifting the title in such a manner appropriate to the experience of the authors who have been NOAA-AVHRR Image Processing for the acquisition of a hotspot point further processed in the GIS.

MapInfo MapInfo learn-Know

Development of software Geographic Information System more rapidly over time, one of the last GIS software and the packaging is beautiful in MapInfo.

MapInfo Professional is a software sebauh designed for applications in the field mapping (mapping). MapInfo GIS users in great demand because it has an interesting characteristic, which is easy to use, relatively inexpensive price, an interactive display and attractive, user friendly, and can use a scripting language costumized owned.

Learning in a Community GIS is shared with what we learn because the science will continue to grow if we continue to share.

MapInfo ---- INTRODUCTION ----

Thus the title of an electronic book that is sharing in the GIS Community.

MapInfo contents of the electronic book contains several chapters as follows:

A. MapInfo STARTED
2. MAIN COMPONENTS KNOWN MapInfo
3. START INPUT DATA
4. MAP EDITING
5. OPERATIONS IN MapInfo
6. PREPARING FOR MAP VIEW (LAYOUT)

interested to read further?

Please ....


Please join the mailing list / google group Geovisi to share together and discuss the perceptions and concepts of GIS (geographic information system) in
http://groups.google.com/group/komunitas-gis

Free from ILWIS 3.4 to ILWIS 3.7 is now there

Learning to use the ILWIS open source software, it is helpful for friends who love to play Raster-based GIS. Various mathematical operations, logical expressions can be applied to create a variety of raster data-driven modeling.

ILWIS Sinau about it was the subject of discussion at the Faculty of Geography KPJ2001 mailing list. ILWIS is a Geographic Information System software and Digital Satellite Image Processing developed by academics.

Free from ILWIS 3.4 to ILWIS 3.7 is now there ...

Interested to learn .. please access http://www.ilwis.org/

PUSPICS involved in Land Cover Mapping Coordination Meeting 1:25.000 Scale administered RAN

PUSPICS back involved in the coordination meeting (coordination meetings) which deals with Land Cover Mapping Scale 1:25.000, which was held on Friday, September 16th, 2011 at the Safari Garden Hotel, Cisarua, Bogor Regency. Organizers of this event is the Center of Natural Resources Land Survey (PSSDAD) Bakosurtanal. At the coordination meetings, PUSPICS chairman, Dr. Diocesan Danoedoro asked to become one of the speakers and deliver material entitled "MAPPING OF COVER / LAND USE TO SCALE 1:25.000 - Specification Information, Presentation Structure, needs resolution, and mapping methods".

During the event, Dr diocesan Danoedoro submit details of the categories or classes that need to be included in 1:25.000 scale land cover maps, based on research ever conducted, namely on Multipurpose Land Use Information that is multidimensional, multitingkat and mainly based on satellite imagery. The substance of this concept is that information that is mjultidimensional land use, land cover dimensions include spectral, spatial, temporal, dimension of the cover / land use, ecological and socio-economic dimension function. Nevertheless, this concept is ideal is not easy to apply given that many of the technical department was interested in making maps cover and land use. One alternative suggested Dr. Danoedoro diocesan land cover map was made ​​with at least two attributes, namely cover and land use as well, but as far as possible be referred to and converted to the classification system used by other agencies.

Event coordination meeting was opened by Deputy Basic Survey of Natural Resources, Dr. Priyadi Kardono, MSc and coordinated by the Head PSSDAD, Drs. Adi Rusmanto, MT, and Drs. Jake Suryanta MSc.

Remote Sensing for Soil Erosion Prediction : A Study in Lake Tondano Catchment Area, North Sulawesi Indonesia

Soil erosion is a natural geomorphic process, taking place persistently over the earth’s surface. Soil erosion is one of the most significant environmental problems in the world today, as it seriously threatens agriculture, natural resources and the environment. In general, the term soil erosion means the destruction of soil by the action of water and wind. Many menthods and formulas have been applied to measure soil erosion,

such as USLE, MUSLE. Due to soil surface erosion has strong correlation with land use, to predict annual erosion by utilizing remotely sensed data which is combined with slope factor is very possible. Therefore, the application of Remote sensing techniques can be used to estimate soil erosion quickly and accurately on large areas.In this technique the availability of Landsat Imagery and Digital Elevation Model (DEM) data are very important.

Landsat-7 ETM after 2003 suffered damage to the optical sensor

Landsat-7 ETM after 2003 suffered damage to the optical sensor, so that there is a number data with the digital value at each pixel is 0 (zero). On page Landsat-7 ETM Striping has written a way to patch the Landsat imagery using Erdas Image Software Modeler with the existing facilities at the desktop.
            From the USGS (or NASA, I forgot .. hehehe ..) itself has an open source software that can be used to execute the same (even better in some scenes that have been done by me ..)

for the software can be downloaded here ..
Then, for the stages, more or less like this ..

A. Prepare the main image
The main image is an image that will be patched. More updates on peliputannya better, and would be great if the number and distribution of clouds a bit, because it certainly will impact the form of lines on the image of the patch later.
2. Prepare the image of the filler
The image is used to patch must also be in good condition, a little cloud, and try peliputannya time not too far from the main image. Image quality is usually a little cloud in the dry months, March, April-August (apparently, ga sure now that often occur climate anomalies).
yes as far as possible point-to-use image is relevant.
3. Initial setup: Create a folder / directory for image storage.
For example:
C: \ AMNH \ gapfill \ anchor: to save the main image file and a folder to save the file image of the fillings.
C: \ AMNH \ gapfill \ fill_scene_1: to save the image file filler.

If you want to add a filler image to a different time, it must make another folder fill_scene_. .... (Sequence of numbers on the last line is used as a processing priority order, not order of shooting time).

Then double click the file to open the program frame_and_fill_ win32.exe.
  frame_and_fill_ win32> Click to Continue


There are three options that must be performed sequentially, that is RE-FRAME, SLC-OFF GAP FILL AND DONE


Stage of the process is as follows:
a. Select the menu SLC RE-FRAME-OFF

On the number of fill scenes, filler content of the image. If there are 3 time decision, then filled with 3 (or equal to how many ... fill_scene_ folder that was created earlier.

In the "DIRECTORY PATH TO SCENE Folders" fill in the location where we store the folder: anchor, fill_scene_1, fill_scene_2, and so earlier.

Then click submit.


  Wait until the process complete.


b. GAP FILL SLC-OFF
Then the box will appear as below:

After that, we will do the gap filling image. Click the GAP FILL SLC-OFF, then you will see a list of bands that will be filled gapnya. If that will be filled for certain bands, such as only bands 5, 4, and 3 are not in the process, then simply by clicking the band 5, band 4 and band 3 and then submit (to save time) but if you want all just click the All Bands. (Left to buy meatballs, mencuuci clothes, sweeping, ngepel, wipe the glass house, cleaning the bathroom, shower and still had to wait about 25 minutes to go ..: D)

c. DONE
If the process has finished, automatically after the process, the file will grow in each folder by naming a different image
. Naming pattern is as follows:
Naming is done prior to re-frame (initial image):
p124r064_06420090617_B10.TIF

After the reframe:
p124r064_06420090617_B10_reg. TIF

After filling the gap:
p124r064_06420090617_B10_reg_ filled.TIF

All the image files stored in the charging Gap: anchor folder.

Picture below is the image of the sequence of conditions:
p124r064_06420090617_B10.TIF
p124r064_06420090617_B10_reg. TIF
p124r064_06420090617_B10_reg_ filled.TIF

Helps the Blind, UGM Students Develop tactual maps and Blind Sonar


The existence of such special maps tactual maps that use Braille (embossed) for persons with visual impairment has not been utilized. Though the existence of this much-needed tactual maps for blind people. Even if there are maps for blind people is still common in nature and not detail. This is what attracted five students from the Department of Cartography and Remote Sensing, Faculty of Geography to promote and develop tactual maps that have previously been made force their sister, Ika Noormuslichah.

The fifth student is a student, the Latitude Galih Sukma, Fedhi Astuti Hartoyo, Erna Indah Sari Noor, Nur Iman Sigit Wibowo and Imron Rosyadi. These five students develop ideas and ideas through Student Creativity Program (CRP)-M for the field of community service "tactual maps of existing city of Yogyakarta, we help blind people to socialize because so far most of them are always accompanied when activity or traveling," said Latitude Wednesday (4/7).

Latitude tells us that there are tactual map is a map of the city of Yogyakarta. The initial idea development and use of tactual maps are the needs of persons with visual impairments in spatial navigation that requires a good understanding. Steps they have taken is the introduction of blind people and help related to spatial problems, such as the position where they are and where they will be going through tactual maps.

"With the limited sense of sight we try to help strengthen the function of hearing and their memories," said Lat. Socialization of tactual maps have been made and tested on ten blind people joined in PERTUNI member (Association of Blind People Indonesia) Branch Lahore. Tactual maps are more detailed information about the city of Yogyakarta.

"If the other more general maps, like maps or a map of the island of Java, Indonesia. While details such as this one where Malioboro or monument, etc., "said a student of Geography Faculty of 2008's. The trial of this map has been carried out for three months. The result, many testimonials from people with disabilities is quite helpful to the presence of tactual maps.

Blind Sonar


In addition to tactual maps, no more blind walk sonar as a tool for blind people. Blind sonar was developed by four students of the Department of Electrical Engineering of UGM. To five students, namely Apri Setiawan, Indra Budi Darmawan, Sugiarto, and Anam Bahr Ulum.N.

The tool developed is quite simple, more streamlined than the stick, as well as practical. According to the principle of blind Apri sonar is to assist blind people in the activity, especially when walking.

 "The principle is to help run because the tool is equipped with sensors. The sensors will vibrate when the goods or people close to within about one meter, "said Apri.

Tools developed through the Student Creativity Program for the field of community service is more safety than the stick used by blind people. In addition this tool can also be designed in a simpler form as the form of mobile phones.

 "No mas complicated. In the future development could be more simple and practical as mobile phones, for example, "explained the student's class 2008 in Electrical Engineering.

Blind sonar, said Apri, consisting of several elements such as ultrasonic sensors, batteries, microprocessor, motor vibration, and tool battery charger. Tool that is estimated to cost approximately two million this if mass produced could be reduced with a more affordable price.

 As well as tactual maps, sonar blind has also been tested with several blind people who joined the Foundation Mardi Wuto Eye Hospital dr. Yap. They also helped with the blind claimed that sonar