Quick Guide How to Use GPS Garmin eTrex Series

I've demonstrated how to create a vector grid in ArcGIS using Hawth's Analysis Tools extension. Unfortunately the extension can not be used in ArcGIS 10. If you are also users of ArcGIS 10, I recommend using an extension of www.ian GeoWizards ET-ko.com to create a vector grid. This extension is also available for ArcGIS version 9.x.

vector grid ArcGIS 10

The following steps to create a vector grid in ArcGIS extension 10 using GeoWizards ET.

1. Download and install GeoWizards ET.

2. Enable extensions ET GeoWizards in ArcMap toolbar.

3. Add Layer Area of Interest (AOI), which would made ​​it a vector grid. Make sure the layers have been added has been in the projection define it, so have the file *. PRJ

4. Run ET GeoWizards. Here is a look GeoWizards ET window, select Basic -> Vector Grid, then click G0

5. Wizards of the first is to determine the source of reference for the outer limit of the grid to be created. You can choose the outer boundary outer boundary layer AOI or ArcMap data view by selecting Current View.

6. Then specify the name of the output vector of the grid, click Next

7. Next determine the input and output coordinate system. If you have been on the AOI layer define the previous projection, then you do not need to change anything here. Unless you want to output it has a coordinate grid system with different inputs, then click the button Select the output coordinate system.

8. Underneath you are required to determine the type of grid, polyline or polygon. Adjust to your needs, click Next.

9. In the past the Wizards, you can change the outer limit of the grid by checking the output and then assign the value XMin Change - ymin (lower left) and XMax - ymax (top right). If you do not want to change, leave without unchecked.

10. Underneath you determine the length and width of the grid as needed. Click Finish.

11. The result as shown in the picture at the top.

Create Vector Grid Extension in ArcGIS 10 Use GeoWizards ET

I've demonstrated how to create a vector grid in ArcGIS using Hawth's Analysis Tools extension. Unfortunately the extension can not be used in ArcGIS 10. If you are also users of ArcGIS 10, I recommend using an extension of www.ian GeoWizards ET-ko.com to create a vector grid. This extension is also available for ArcGIS version 9.x.

vector grid ArcGIS 10

The following steps to create a vector grid in ArcGIS extension 10 using GeoWizards ET.

1. Download and install GeoWizards ET.

2. Enable extensions ET GeoWizards in ArcMap toolbar.

3. Add Layer Area of ​​Interest (AOI), which would made it a vector grid. Make sure the layers have been added has been in the projection define it, so have the file *. PRJ

4. Run ET GeoWizards. Here is a look GeoWizards ET window, select Basic -> Vector Grid, then click G0

5. Wizards of the first is to determine the source of reference for the outer limit of the grid to be created. You can choose the outer boundary outer boundary layer AOI or ArcMap data view by selecting Current View.

6. Then specify the name of the output vector of the grid, click Next

7. Next determine the input and output coordinate system. If you have been on the AOI layer define the previous projection, then you do not need to change anything here. Unless you want to output it has a coordinate grid system with different inputs, then click the button Select the output coordinate system.

8. Underneath you are required to determine the type of grid, polyline or polygon. Adjust to your needs, click Next.

9. In the past the Wizards, you can change the outer limit of the grid by checking the output and then assign the value XMin Change - ymin (lower left) and XMax - ymax (top right). If you do not want to change, leave without unchecked.

10. Underneath you determine the length and width of the grid as needed. Click Finish.

11. The result as shown in the picture at the top.

Creating a Watershed in Global Mapper 12

One new feature in Global Mapper 12 in addition to the feature to download data ASTER GDEM is a Generate Watershed or create a watershed (catchment). This new feature can be found via the menu File -> Generate Watershed.


via dominoc925.blogspot.com
Data needed to make a watershed in Global Mapper 12 is a raster data grid. You can download the SRTM data or GDEM ASTER data directly from Global Mapper 12 is to exercise. Examples of the above picture using LIDAR data.


Here below are the settings Watershed Generation Options window.

If necessary, you can change the value of the X-axis and Y-axis on the resolution settings. The greater the fill value, the smaller the resolution obtained, the consequence is the process generates a faster flow of the river, but the results obtained was not optimal (often the result is not as expected, for example of the visualization of raster data streams are clearly visible, but the flow is not in generate / not created for the flow)

In the process of making watershed in ArcGIS, we know the process of filling sinks, nah Depression Fill Depth is the same as the process of filling the sinks, where the Global Mapper will control how deep of a basin for "patched" before the basin is considered as a part of the watershed. If you do not want this process, fill with value 0, it will speed up data processing.

If you just want to get the flow of the river course, un-check the Create Watershed Areas Showing Drainage to Streams. If you check the option, in addition to the flow of the river, you'll also get a watershed in the form of polygons. Every time I tried to make the river flow following the watershed of his, I always cancel it, because it takes a very long time. I recently tried to stage produce a flow of the river course. The result as shown in the picture at the top. Maybe you want to try it? I recommend using the data with a minimum area, so that the process is faster.
Open Source GIS gvSIG 1:11 Portable

Open Source GIS gvSIG 1:11 newest version is now available in portable format to be run directly from USB Flash Disk, or you can also copy to your computer to be operated without the need installation at all. 1:11 gvSIG portable is available for Windows and Linux.


Previously I've posted about some open source GIS software portable and portable GPS in GIS this blog, including QuickGrid Portable, Portable OziExplorer, MapSource Portable, Portable Floppy GIS, as well as the most complete is the Portable GIS Archaeogeek V2 of the package is included in QGIS (with GRASS plugin), uDIG, gvSIG for desktop GIS and Mapserver, OpenLayers, Tilecache, Featureserver, and GeoServer for web applications.

Open Source GIS gvSIG contained in V2 Portable GIS is a long version, the latest is gvSIG version 1.11. Total size after unzipping about 285 MB. This portable format not only contains the program file to run gvSIG, but also the Java Runtime Engine, so if the computer you use to run gvSIG portable Java is not installed, this software can still use. gvSIG is made based on Java.

If you run gvSIG portable for the first time, the default language used is Spanish, because it's open source software is made in Spain. To change the language to Bahasa follow the following steps (see picture below):

Run the program gvSIG portable
From the menu "Ventana" select "Preferencias".
From the window that opens click the + on the "General", then select "Idioma".
Choose the language diingkinkan (Bahasa), click "Aceptar", restart the program gvSIG portable

Idiot Guide Learning PostGIS

PostGIS, which currently has a written version 1.5.2, is a spatial database extender for PostgreSQL Database Management System, which is used as a backend spatial database for geographic information systems (GIS), such as ESRI SDE or Oracle's Spatial extension. Unlike the two last-mentioned database servers, PostGIS is an open source GIS software under the GNU General Public License.

If you just want to start studying PostGIS, BostonGIS has made PostGIS and PostgreSQL tutorials on its website. For starters, maybe you could start with the Getting Started With PostGIS: An almost Idiot's Guide.


There is more guidance to learn the PostGIS on the site, please look at his homepage to find other tutorials PostGIS and PostgreSQL.

BostonGIS has also released a book PostGIS in Action in hardcopy and PDF format. I've posted previously about this book in May 2009. Now the book has many revisions, a more complete discussion and thicker, last updated in April 2011. PDF format of the book is actually a lot of "scattered" on the internet for download through file sharing sites

Image Rectification Using ArcGIS

Create a post yesterday GIS Image Download results of Google Maps utilizing the tools available in Global Mapper to perform image rectification. You could also use ArcGIS to perform rectification of satellite images or images downloaded from Google Maps.


In the video tutorials below show how to perform image rectification by taking the reference coordinates using Google Maps utilizing Maps Labs - LatLng Marker. Same manner used in previous tutorials.


With reference coordinates from Google Maps, you are shown how to do the rectification in ArcGIS using the Georeferencing tool. Learn more about video on how to perform image rectification in ArcGIS

Inserting File (PDF, Doc, JPG) into the Geodatabase at ArcGIS Layer 10

One fitu new in ArcGIS 10 is the ability to insert files (attachments) into the layer. With attachments, the user can add information related to that layer. Attachments almost similar to hyperlinks, but the user can insert more than one file (various types of file formats) into a geodatabase layer.


Files that are used as inserts (attachments) are stored in the geodatabase, and the file can be displayed in several ways, according to the file format that has been inserted, can also be opened via the web applications, ArcGIS Explorer, or ArcReader.


Link between layers (feature classes) and files that are inserted using a relationship class, so the ability to insert files or edit them only in ArcEditor or ArcInfo license. While ArcView license can only be used to display any attachments.

Here is a summary of the steps to activate the attachments feature in ArcGIS 10, add / edit the file to be inserted and how to display it.

(There are also mini-tutorial in PDF format full screenshot. Download link available at the end of this post)

Attachments feature is enabled via the Catalog window (ArcCatalog). The trick right-click the feature class, select Attachments -> Create Attachments. Drag the result into the ArcMap display.
Next right click on feature classes in the TOC, select Edit Features -> Start Editing.
Then by using the arrows on the toolbar Edit Tool, select an individual feature that you want to paste the file into it, then right click select Attributes.
Select Open Attachment Manager. In the Attachment Manager window that opens, click Add, browse to the location of the file you want to insert into the layer.


To display the results, simply click the individual and use features earlier Identify button. To open the file, double click on the attachment.


You can also display the results of these attachments in HTML Pop-up, by first doing a little feature settings in the Properties class. The trick, right-click the feature class, select Properties. Layer Properties from the open, move it to the HTML Pop-up tab. Perform the settings and then click Verify. Click Apply and then click OK. The result can be viewed using the HTML popup button as shown in the picture above this post.
Attachments are stored in the geodatabase, so you can divide the geodatabase to others or made a package using a toolbar folder to be opened in ArcReader Publisher automatically file attachments that are already included in it.

Download Bing Maps Aerial Imagery Theme For Windows 7

Microsoft released for Windows 7 themes sourced from Bing Maps Aerial Imagery. Themes can be downloaded for free via the official website of Windows 7 themes gallery.

Bing Maps Aerial Imagery Windows 7 Themes This is a dynamic theme that will automatically perform updates while your computer is connected to the internet. Therefore, you must click the option "Download Attachments" to the system automatically downloads the image files to your computer. The images will be stored in a special folder on your computer and will automatically appear on the desktop so you select the dynamic theme.

Geological Map of Indonesia

In the last two weeks, on the mailing list RSGISForum many are interested to download the data and the geological faults in Indonesia. The download link is provided by any member of the mailing list lately is no longer available and that have been successfully downloaded before it had a password. Other mailing list members who are still many who are interested in the geological data.


In GIS Blog currently has available a download link Geological Map of Indonesia. But unlike the geological data is on the mailing list RSGISForum, Geological Map of Indonesia is in the form of printed maps scanning of Research and Development Center of Geology and vector data lines with the format dxf (CAD format - interchange files with DWG). The map scale is 1: 5,000,000, with a geographic projection system, the 1996 edition.

New Look at Google and Google Maps

Tuesday, Google's redesign looks. Not just on Google Search, Google Maps also has a fresher appearance. Major theme at this new design is "more focused, elastic, and effortless."

Display Google Maps now has seen many angles, see the print icon, email and a link on the image above contained in the light gray box, which at last look, there are also three icons in addition to writing beside

But apparently, Google is forgetting something, namely the loss of the feature "View in Earth Link", where users can directly download the My Maps KML files with one click. For the moment, Google only provides a small solution for users who want to download the My Maps as a KML file by adding '& output = kml "(without quotation marks) at the end of the URL in the browser address bar and press enter.

You can read more about this new look at blogs google-latlong.blogspot.com. In addition to redesigning the look of its Google also released a new social network named Google + Project, which in large sieve-sieve sebaga pesain Facebook (?). If you look at the demo site Google + Project, you can zoom and pan as easily as on Google Maps, because it is a demo site was created using the Google Maps API.

Delphi Tutorials Using MapObjects

GIS Programming a module with MapObjects Version 2.2 using Borland Delphi version 5.0 which can be downloaded free at GISiana.Info / FreeGISTutorial. Here are a few 'chapters' that can be learned from GIS Programming tutorials are presented step by step in 26 pages, namely:


• Display a map with multiple layers
• Control panning and zooming
• Create a toolbar control
• Display map layers based on scale
• Perform spatial and logical queries
• Draw simple graphics on the map
• Display features with thematic renderers
• dynamically displays real-time data with an event tracking layer
• Programmatically add data to a folder

MapInfo GIS Tutorial: Programming With Mapbasic

Book series of digital programming with MapInfo Geographic Information System is available on the mailing list MapBasic GIS Community is the basics of using the MapBasic programming tools. MapInfo GIS tutorial is one of the book series of GIS Text Book issued by GeoVisi. Previously I also post the GIS Tutorial: Digital Image Processing Using ArcGIS which is also the output of the team GeoVisi.
Following the discussion contained in this ebook is 30 pages thick:


1. MapBasic Programming Basics

1.1 Basic Elements of Programming MapBasic

1.2 How the Programming

2. Procedures, Functions and Basic Feature Application Programming In

MapBasic

2.1 Procedure

2.2 Function

2.3 Passing variable (by reference and by value)

2.4 Control Program

2.5 Include

Module 2.6 Managing the Project File

Creating Your Own Application of GIS with Open Source Program

For specific needs, a user not familiar with GIS and do not want to know how a GIS application can be produced, pragmatically, the user wants to perform on-screen map of the location he wants, can zoom in and zoom out, can display the location information and perform simple query. To meet it, a GIS Programmer's going to make a standalone GIS application tailored to the needs of the user.

I've toyed with the ArcView Avenue Script congenital 3.x to customize the order in accordance with the end user. Later still there is a request to be made a standalone GIS application, where the user does not want to know, how to make and what software is behind the application of GIS later.

If you are still playing with Avenue The script, of course, must play well with the legality of the software. But now there is an open source GIS software, which can be used as tools to customize so as to produce a standalone GIS application, which is free to use, not tied to the legality of a software. Examples are MapWindow GIS Software. Aside from being a desktop GIS like ArcView 3.x, the MapWindow GIS ActiveX Control is also available MapWinGIS. By using this control, you can create your own version of your own GIS applications. Another example is gvSIG.

Blog Desktop GIS Book in one of its news, shows how to create a GIS application that you can make your own by utilizing some of the Open Source GIS software follows:

QGIS 1.0
PyQt4
Qt 4.3 or higher and the development tools (Designer)
Python 2.3 or better
For more details please go to the post: Creating a Standalone GIS Application section first. You still have to wait for posting of the next Desktop GIS Book that will show you how to add some features needed in a simple GIS application.

TatukGIS Editor Version 3.0 Released with 3D Feature Mapping

TatukGIS Editor is a desktop GIS mapping software at the same time spatial data editing applications that can be customized using scripting tools that are already available in it. The user interface of GIS software is available in 16 languages​​.


TatukGIS Editor itself has just released the newest version V 3.0 with 3D Mapping features include:

3D viewing seamless integration
3D capabilities include the presentation of DTM (digital terrain models)
3D vector rendering, automatic draping of a 2D image and vector layers over DTM models
flood simulation, fly-over, control lights, powerful camera / observer control
If the project folder DTM data available, automatically the data can be used as a 3D model. With the ability TatukGIS Editor which has a built-in scripting tools, you can create an application program to perform customization of data / maps available. You can program such as flood simulation by adjusting the camera angle when the position of the fly, etc..

TatukGIS Editor V3.0 The latest release of March 22, 2011 is available in the paid version and trial version. You can also download for free TatukGIS Viewer. Viewer has owned all versions of the data minus Editor creation / editing, scripting, and features 3D viewing. You must register first to download trial versions and free versions.

Google Maps 5.7 for Android Provides Features Download Area Map

Google Maps 5.7 for Android was released yesterday with a new feature "Download Area Map" which serves to download the maps Google Maps to be used offline. This feature can be activated via the Labs page.


Features "Download Map Area" to Obtain a map of Google Maps Will download the area with a radius of 10 miles from the location of the user chose. Users can still download it again the other locations That overlap with the previous map.

The process of downloading the Google Maps map may take Several minutes. Just save the downloaded maps "landmarks" alone, not including satellite images and 3D building.

You can see a demo video "how to download Google Maps data for offline use" on www.AndroidCentral.com:

Download Area Features Map is useful for the traveler Pls They want to visit other areas, but worried about the quality of internet connections in the area. By first downloading the folder to be opened offline, at least That worry can be eliminated. Read also features a "Transit Navigation" on Google Maps 5.7 for Android here.

To you the traveler the WHO does not have a phone or a tablet with the Android operating system, but want to download maps from Google Maps to destinations of your visit,

Creating KML from Shapefile Using 3D SHP2KML Freeware

this post will show you how to create KML files 3-dimensional (3D) data from the shapefile using the freeware SHP2KML to display in Google Earth. Shapefile data I use is the same data to show an example of using fusion to google shapefile conversion tables, population census results of 2010 in Central Jakarta.The end result of the example that I made this as shown in the picture above. Where to look 3D view of data such as population bar graph, with each sub-district boundaries appear below. That looks like a bar graph is a polygon shapefile format from the centroid in each district. The shapefile is in the process of using a freeware 3D KML SHP2KML to be, while the district boundary is a two-dimensional shapes are also created using the same application.

OK, the following steps to create a 3D KML from shapefile data using freeware SHP2KML.

Specify shapefile data input and system coordinates. It is strongly recommended you use the unit shapefile Geographic (Lat / Long). Click Next.
Here you set the display when the mouse will hold to its features, information from attribute columns in which you want to perform, as well as determining the choice of the color feature that will automatically change to follow the movement of the mouse (if it displays the label roll over). For the symbology you can specify unique value based on a specific column (of type string or numeric) or a single symbol or Graduate Value based on a column of type numeric.
Here you set the color of your choice prior symbology. You can adjust the color by clicking the default colors available.
This stage you set what columns you want in the show feature when clicked by the user which will perform a balloon as shown in the picture at the top (data Kecataman Cempaka Putih). You also can set the background color and font color table as you wish.
At this stage you can fill the layer title and description. The most important thing at this stage is that the 3D settings in the Options. Make sure the 3D option in check, then it adalaha Altitude Mode Relative to Ground, and select Field Value in accordance with the data you want visualized as three-dimensional shapes. Finally, set the value on the field Factor. In this example, I am content 0.01 or one hundredth of the value of his data so that the resulting 3-dimensional shape is not too high.
Click Create or Create and Open KML for display in Google Earth directly. The result as shown in the picture above this post.
You can also create sub-district boundary with the polygon into 3D format as shown below. Which is more interesting and informative do you think?

Edit & Convert KML Using GDB to RouteConverter

GDB conversion to KML can be easily done on Google Earth, but I often receive GPS data tracking the results of engineers in the office who need a lot of editing because of several reasons. In Google Earth it is difficult to do the editing track or route. By using the free application without installation called RouteConverter this, the editing process route, track and waypoint becomes easier.RouteConverter is also a cross-platform applications that can do the conversion to various types of file formats. There are about 70 types of file formats supported by Java-based application that can be used on Linux, Windows and Mac this.

You can display the route, track or waypoint using the background maps from Google Maps on this RouteConverter applications. You also can change the display background maps from OpenStreetMap. It is also possible to complete the elevation data on the track, route and waypoint from SRTM data. You need an internet connection to be able to utilize all of these features.

New and Improved Features in ArcGIS 10.1

ArcGIS 10.1 scheduled to be released early in 2012, while the Beta 1 version will be released this July. ESRI ArcGIS will use Beta Community http://betacommunity.esri.com to introduce ArcGIS 10.1 beta is. For users of the U.S. can register on the site, while users from other countries must be nominated by the country concerned ESRI distributor. What are the new and improved features in ArcGIS Desktop 1.10?


Here are the Top 10 Improvement in 10.1 For ArcGIS Desktop:

10. The increase in the search menu / Searching, searching with ease transform and determination of the proper projection systems, spatial filtering to search in the map being displayed and to support spatial search for a specific keyword.

9. Update your information in the menu editor tracking Editor

8. Geotag photos auto generate feature points of the folder containing the photos that have been geotagged.

7. GPX to features tool features are now available by default to display GPS data waypoints, tracks and routes. In ArcGIS 10 I use this add-in toolbox Convert GPSFile to SHP

6. KML to Layers feature supports the use of pop-ups import simboldan

5. Two new features in Cartography generalization tools to make the area a way to ease simplification scale changes that were previously only dilakuakan manually.

4. The new interface for administration geodatabase that the user can perform view and locking arrangements geodatabase.

3. Improvements to Labeling feature with automatic placement deksripstif text on the map.

2. Legend dynamic that could change with the change of map scale.

1. Share As new features for ease of sharing spatial data and map-making package (package map).

ESRI has also announced changes in ArcGIS 10.1 naming because the fact is, however ArcGIS is used, basically using the same system.

Showing Results Thumb Picture Geotagging in ArcMap I try to make special tips on how to view picture thumb ArcMap fromthe geotagged photo using free geotagging software GPicSync.About GPicSync I've ever posted here before, namely applicationsthat function automatically inserts location information to the photometadata (geotagging) so the photo can be displayed in Google Earth (KML format) using the reference GPS track timeline.


GPicSync each photo for the geotagging process always generateKML files that can be opened in Google Earth or ArcGIS ExplorerDesktop. In addition, also automatically generate a folder with the name Thumbs containing the photo but with small dimensions(resize the result) that is 160x120 pixels. By utilizing the KML file(usually has a name doc.kml) and the Thumbs folder you cancreate picture thumb in ArcMap using the Add-in toolbox ConvertGPSFile to SHP through sub-tools KML to SHP. About Add-intoolbox Convert GPSFile to SHP I've ever posted here.

Download Map High Resolution 2011 Forest Moratorium

Government through the Ministry of Forestry has issued a newpermit delays indicative map (map forest moratorium) ofPresidential Instruction 10/2011 on the new license suspension and completion of primary governance of natural forests and peatlands.You can download a moratorium on forest maps with high resolutionjpg format with a scale of 1:250.000 through Forestry WebGIS site.


Map of forest moratorium, according to the Secretary General of the Ministry of Forestry, made ​​using radar images and will be updatedevery six months sekali.Anda can download maps with a scale1:250.000 forest moratorium (291 Sheets) in JPEG format via thelink below


Dowload Peta Moratorium Hutan 2011


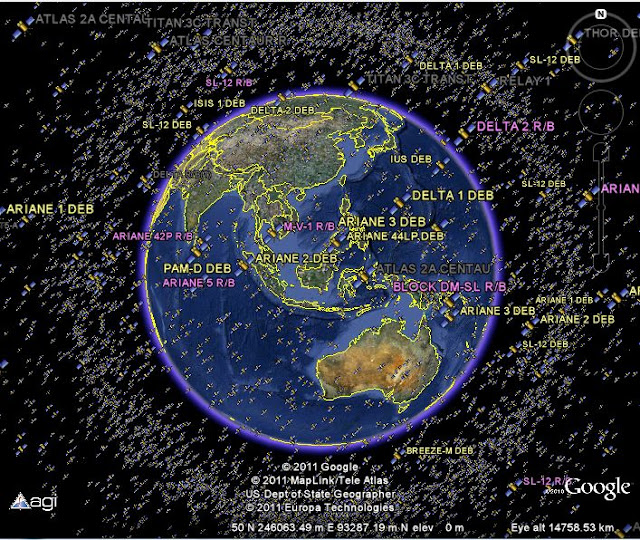
Seeing the Real Time Satellite Position All Around the Earth Through Google Earth Here is the real time position (updates after 30 seconds) approximately 13.000 satellites around the planet That you can seein Google Earth. This collection was developed by someone namedMatt from Analytic Graphics Inc. ..


The picture looks like the above, or you can see the position of thesatellite in real time updates every 30 seconds from the Googlegadget below (takes 30-60 seconds to be able to show satellitepositions, depending on the speed of your computer).

You can also download satellite position kmz file (46 kb) to be opened in Google Earth, or simply view it through a YouTube videoat this link.
Satellite Around The Earth

Gadgets powered by Google

GIS Image Using Open Source GIS uDIG


GIS image using one of the Open Source GIS which is an alternative uDIG selaingeoreference using GIS and Quantum GISimage also conducted using ArcGIS Explorer (free download of thelatest ESRI GIS Viewer is here). Previously also shown how to use the Global Mapper GIS contained in the e-book "Making GIS ImageResults Download from Google Maps", sertarektifikasi image / image using ArcGIS Desktop here.

GIS image using this uDIG utilizing the latest plugin ImageGeoreferencing View, version 1.0.0. This plugin is already inujicobakan using uDig 1.2.1. Video below present the use of the plugin where the user adds the path as a base layer ground controlpoints (GCP).

Garmin Nuvi 3770LM release with 3D Building Indonesia Indonesia Garmin GPS navigator released a new variants, namelyNuvi 3770LM (LM: Live Map Update Time) with a special feature isthe 3D view 3D terrain building and to several cities in Indonesia.You can see a representation of high buildings in various cities andcontour maps at low zoom levels, which gives a realistic perspective on terrain.

Besides GPS Garmin Nuvi 3770LM player also features audio / video and portable media, compass, comes a new capacitivemultisentuh screen designed using clear glass, clear, and more sensitive, technological nĂ¼Route ™ with myTrends ™, navigation isactivated by voice, info line with the look of a crossroads, as well asmap updates free for life.

Spatial Analysis Determining the Place of Hiding Osama bin Laden Professor of Geography University of California-Los Angeles (UCLA) Thomas Gillespie and John Agnew, using spatial analysisto determine the hiding place of Osama bin Laden. They makemodels of the terrorist leader's quest to use the same technique totrack the animals and migratory patterns.


Credit: MIT International Review
A number of biological models can be very useful in finding Osamabin Laden.Pertama called the theory of distance decay (DD). This theory describes the effect on the cultural distance or spatialinteractions. The possibility of finding other animals decreasedexponentially when going further from the residence.

Both called the Island Biogeography (IB), this theory refers to thearea of ​​habitat surrounded by a region uninhabitable.

Through both ways, information about a particular animal will be narrowed on the animals could be found. Through DD, bin Laden is known will not go far from the last place he had known. Through theIB, bin Laden is known to be most likely to be found in big cities.