One of the advantages of GIS is the Query Expression tools. This tool is a detailed definition (expression) is used to determine what (record or spatial elements) that actually want to be selected by the user. Create a query expression is a right way to conduct the election of the elements, because this expression can involve a lot of attributes, operators and the count process. In the following example, suppose the user already has a map of administrative districts in which there are few districts. Population statistics (eg sub-area and population) are available at the district level, and users want to find which districts that meet certain criteria, such as a population less than 25,000 people and the extent of less than 5000 (the union area corresponding table). Query Expression therefore necessary to define both these criteria. For this purpose, the user can take the following steps: Show view and theme that covers the relevant area of study.
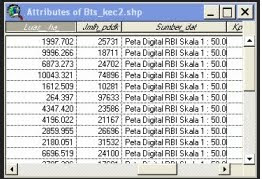
Show attribute data contained in its theme attribute table.
Turn it back (click) view is concerned, and click the button icon was the "Query Builder" dialog box to appear for the active theme. In the item fields available on the dialog box, double click on "[Population]" (checklist update value in order to bring up the value of each criteria), click buton less than or equal to, type "25000", click the button "And ", double click on" [the area] ", click the button take more than or equal to, type" 5000 ".
Click the button was the "New Set" ArcView to directly execute the query you just created, and the elements in question will be selected and highlighted in the table and shown in his chart as shown below. Read also about how to fill the selected elements at once (advanced query expression arc view). good luck ...


