Information cover / land use derived from Landsat-7 imagery created by LAPAN, while the elevation data obtained from the RAN and is used as a reference. Because it is used as a reference it is assumed that the accuracy of the height of the topographical map 1:25.000 scale better than the accuracy of height-SRTM DEM data.
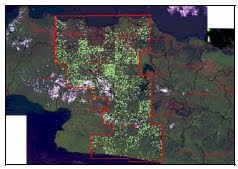
Areas that are used as research samples (Figure 1) is part of West Java region representing a variety of heights and types of cover / land use. The studied region covers an area of Tangerang, Jakarta, Jakarta, to the south to the coastal district Cianjur.
1.2. Cover / land use in West Java
Cover / land use that are used are made from interpretation of Landsat satellite imagery from 2002-2003 made by Pusbangja on the inventory of natural resources in 2004, the interpretation done on a scale of 1:100,000 mapping. Figure 2 below shows the information cover / land use in West Java.

2. RESEARCH METHODOLOGY
The first is the extraction of the position / location and the high point of the scale topographical map 1:25.000 with a way to scan the map into data jpeg, jpeg then the data scanned so as to have corrected the geometry of geographic coordinates and stored in a format ECw. From the data of the geometry correction is done deleniasi / high point for the identification of the point obtained geographic coordinates and altitude information at that point. The position coordinates with the data obtained dioverlay cover / land use and SRTM DEM data so that each position coordinates of the real has information height (from the data map form of the earth), the type of land cover, and elevation of the SRTM DEM data.
Areas studied were divided into 2 parts (left and right parts) (Fig. 3). The results of statistical analysis of the first region to be a comparison / control statistical analysis of the results of section 2. By comparing statistics obtained from the two regions will be known how far the influence of differences in land cover to the value of height-SRTM DEM data.
Coordinate information of each position are grouped by type of land cover. Land cover classes used were forests, plantations, groves, open land, farm / moor, ponds, irrigated fields, villages, and cities.
Once grouped by land cover units for each observed position coordinates of the high points of information obtained from topographical maps and SRTM DEM of the data compared, and the statistics are made about the height difference (mean difference and the deviation of the difference). By knowing the average difference and the deviation of the difference it will be known how much precision measurement of the height of the SRTM DEM dipeleh of the data.


3. RESULTS AND DISCUSSION
Overlay geographical coordinates of points that contains the height information from topographical maps, the DEM-SRTM, and type of cover / land use can be seen in Figure 4. In the table overlay results are presented in Table 1.
From Table 1 performed grouping data based on land cover, each group statistical difference measurement computed data. Table 2 shows the statistical results of the measurement differences between the SRTM-DEM data with topographical elevation data for the region to the right.
Topographic-and SRTM DEM about 15 meters, this suggests that the results of measurements of the height-SRTM DEM is 15 meters higher than the topographical elevation data, this difference is caused by the height of forest land and plantations cover an average of 15 meters. The object being measured height of the DEM data is the surface cover or canopy of the forest or plantation while measured by the topographical map is the height from ground level. Differences in the measured object from the data (DEM and rpbm) requires that the height calibration, data-SRTM DEM needs to be calibrated or decreased in value based on the height of land cover.
To groves and fields of land cover / dry shown by Table 2, the measurement height of 3-4 meter DEM data is higher. As an explanation for the forests and plantations due to the above then this is the average height of shrub land cover and farm / moor is 3 to 4 meters. As for the other land cover farms, open land, fields, villages and urban land cover in the absence of a significant elevation caused by measurement of the relative SRTM DEM data, together with topographical height of the data. Object of the water body is not included in the analysis because of the height of the water body is calculated in the algorithm fails interferometry (discontinew).
Accuracy of measurements taken from SRTM DEM data, indicated by the standard
deviation of the difference measurement. For forests and plantations standard deviation values of table 2 is about 13 meters, this means that the height measurement accuracy of the data-SRTM DEM is 13 meters. Measurement error of 13 meters is caused by variations in elevation than the land cover of forest or plantation is also caused by internal errors of the SRTM-DEM data.
Precision measurement of the height of the paddy fields and ponds around 1-2 meters, due to variations in land cover ponds and rice fields almost no (<1 meter), then the measurement error of 1-2 meters of paddy fields and ponds due to internal error-SRTM DEM data itself.
In general, that the data-SRTM DEM has two kinds of errors, the first error caused by variations in the height of land cover and the second error of the system that produces a data-SRTM DEM (internal error). From Table 2 and described above then the measurement error resulting from the production system-SRTM DEM data ranges from 2 meters, while the other error resulting from land cover types.
Table 3 shows the results of measuring the difference between statitik-SRTM DEM data with topographical elevation data for the region to the left.
On the left side of the average height of forest and plantation areas is lower than the right. In contrast to the region on the right side where the altitude forests and plantations are the same then the average height of the plantations in this region is lower than the forest. Keteltian level height in forest cover on the right (12 meters) higher than the precision on the left (18 meters).
From the analysis of Table 2 and Table 3 above turns out that the accuracy of different heights to the left and right, the average difference in elevation for each land use in the second part is also different. There are two similarities of the two tables above, the first is that the higher elevation land covers the measurement of the average difference between the SRTM-DEM data with greater topographical elevation data, the higher the variation in the value of the land cover greater heights so that the level of accuracy to be lower third measurement accuracy of the DEM-SRTM elevation is below 20 meters, whereas if the forests did not exist then the measurement accuracy to below 13 meters, while for paddy fields, ponds had the highest ketelitin is under 3 meters.
4. CONCLUSION
The conclusion of this study are:
- Land cover affect the accuracy of measurement data, the SRTM DEM
- Value-SRTM DEM on land with a high elevation (forest plantations) need to do calibration
(reduction).
- The measurement accuracy depends on the SRTM DEM, land cover, forest land where the lowest
measurement accuracy, while in the fishponds, the highest measurement accuracy sawa.
- The level of measurement error-SRTM DEM data are generally below 20 meters
5. ADVICE
The use of SRTM-DEM data for mapping purposes should consider the mapped region, if the area is generally mapped wetland, the SRTM DEM data can be used for large-scale mapping
greater, whereas if the hills where most of the forest land cover data usage SRTM DEM-scale maps are used to lower