Classification images with ENVI EX, Easier!

ENVI EX is the latest addition in the ENVI software for image processing and analysis software products. ENVI is a selection of scientists and professional image for extracting accurate scientific information from the image. Now ENVI EX gives, scientifically accurate process to prove that ENVI is known in the workflow step-by-step revolutionary quick and easy guide you through advanced image processing tasks, regardless of the level of experience using it.


              ENVI EX is a pretty amazing device with dynamic display that allows to quickly see the results of remote sensing or image manipulation, vector, and explanations. Tampilanya provides quick access to common tools such as the display contrast, brightness, sharpen, and color transparency in the image. Can work with multiple layers of data at a time and in one window, using the Data Manager and Layer Manager to keep track of multiple datasets, and "punch through" layer to see and work with one layer or another layer in the same window. In addition, ENVI EX can reproject and resample the image and vector-on-the-fly. ENVI EX works seamlessly with layers and features from ESRI and allows you to create professional map presentation.
               For classification. You can optionally apply a subset of the space or spectral, and / or a mask for the input. Input classification requires a minimum of two bands. Iput types that are compatible ENVI, TIFF, NITF, JPEG 2000, JPEG, image Erdas, ESRI raster and raster geodatabase.


              Guided and supervised classification can be done quickly, easily and seamlessly. Classification to be supervised more easily with the feature extraction / image segmentation of ENVI EX. Feature extraction method was first developed in graphic design software to "trace" feature / object seen in the picture, and the current ENVI and Idrisi also have applied this method to extract the information contained in the satellite imagery. Even ENVI EX has been combined (feature extraction) with the K-nearest neighborhood method to perform supervised classification directly. Feature extraction is very helpful in the job classification of LULC using satellite imagery, because this method can identify the LULC classes not only pixel-based, but also take into account in the interpretation of other components, such as shape and texture of the features / objects that appear in the image. Kedetailan level of accuracy and can be adjusted as needed. Other data such as elevation, slope, or NDVI can be added as the supporting data in the process of feature extraction.

Fokker plane crashes in Housing

Air Force's trainer aircraft type Fokker 27-500 apparently fell through neighborhoods in Jalan Branjangan, RW 11, the Air Force Eagle Complex, at Halim Perdanakusuma airport.

According to one resident who declined to be named, there are at least five of the affected aircraft. "The plane crashed near the SDN Space. There was a fire in the houses," he said, Thursday (06/21/2012).

So far, reporters were not allowed into the crash site. Air Force members on guard around the complex and close region.

Reported previously, the plane crashed around Halim Perdanakusuma Airport, Jakarta, on Thursday at around 15:00, when doing an exercise routine.

According to The Center for Information TNI Laksma Iskandar Sitompul, the plane is operated by the pilot and copilot Major Flight Lieutenant Paul Heru.

Suspected Meteor Falling objects in Balaraja

An object suspected meteor fell on a mes employees of the Road Attack, Balaraja, Tangerang regency. Former dropping objects were damaged roof space of the building, a motorcycle, and ambles to the ground.


"It was also wounded an employee's stay in the mess," said Chief of Police Sector Balaraja, Adjunct Commissioner Dody Prawiranegara, Thursday, June 21, 2012.

According to Dody, the object falls at about 5:00 this morning hit a mes room employees Rezeki PD Partners. Riswan, the name of the employee, suffered bruises.

Police are now sterilize the location and give the police line as people flocked to see the location of objects falling from space are suspected.

It leaves a mark falling objects such as roofs and ceilings of houses destroyed, the motorcycle were also destroyed, and broken floor tiles and land subsidence.

Software "free" data processing GIS and Remote Sensing

Some software for data processing GIS (geographic information system) and remote sensing can be operated in "free" without having to buy a license. Its capabilities are equivalent to other software that is licensed. Below are some software that can try to operate in GIS data processing.
Quantum GIS
GIS software ArcGIS looks somewhat similar to this can be downloaded at: http://www.qgis.org/.
In the link are also available from the help of the manual and the QGIS blog forum for all users who want to discuss and share information.

GRASS
This is the software for data processing of remote sensing imagery (remote sensing). Can be downloaded at: http://grass.osgeo.org/download/index.php, and to the manuals can be downloaded at the link: http://www.grassbook.org/, sometimes by opening the link download QGIS, GRASS This is installed with atomatis. Please try to unlock features basic image processing. Personal opinion, I was a little difficult at first to open the (ordinary), but could try to further advance the software on this one.
ILWIS
ILWIS GIS is a data processing software as well as remote sensing with the principles of raster based. Developed initially by the ITC (www.itc.nl), and now the software is already in the category of open source. Can be downloaded at: http://www.ilwis.org/. ILWIS facilities include several remote sensing image processing (RGB, composite band, Principle Component), if the digital data DEM (Digital Elevation Model), making anaglyph (3D view of the image of DEM with optical image), hydro processing facility drainage pattern maker (the river flow) of the DEM data, and others.
RAT
RAT is a "mouse" symbol of open source software for radar imagery. Can be downloaded at: http://radartools.berlios.de/. Image processing software applications such as radar and radar image intensity manufacturing (multilook) processing interferometry, polarimetric radar. All can be operated here. For those who like Linux, UNIX or Mac OS X, RAT is very compatible in that OS. Some experiments can also be operated in the window.
NEST
RAT NEST is somewhat similar to that for image processing was developed by the Agency radar.Software Antarika Europe (EOS: European Space Agency http://www.esa.int). This software can process and read the data from the radar platform is already known as: RADARSAT-2, Envisat, ERS-1, ERS-2, Alos PAlsar, TerraSAR. Some level of data can be read here. For more details about what facilities are included in this software can go to this link: http://nest.array.ca/web/nest.

Creating a watershed pattern (PAS) using ILWIS

This time I will discuss its hydroprocessing ILWIS tool to extract patterns from data streams digital elevation model (DEM).
Knowledge of flow patterns is essential in many areas of science. For example, for the needs of geological analysis, PAS could be clues in the interpretation of rocks and geological structures. Some of the flow pattern that reflects berbeda2 different rocks. For the analysis of flood and irrigation, PAS is also used for analysis and determination of water catchment basin (watershed). PAS depends on the accuracy of the data base and scale DEM needs (ex: a regional scale or local scale).
Below is an example of how to extract the PAS with the technical baseline SRTM 90m DEM using ILWIS program.
Dataset: SRTM 90m DEM (GeoTiff)
Method: DEM hydroprocessing
Steps:
A. Import the SRTM DEM (tiff format) into ILWIS format using Import Geogateway
2. Operation - DEM hyroprocessing - Flow-Fill sink determination
and for all, terminology DEM replaced with file_Fillsink


3. Operation - DEM hyroprocessing - Flow determination - Flow Direction
Input DEM: Naivasha_FillSink
Output: Naivasha_FlowDirection


4. Operation – DEM hyroprocessing – Flow determination – Flow Accumulation

5. Operation – DEM hyroprocessing – Network and Catchment Extraction-Drainage Network Extraction
Input : Naivasha_FlowAccumulation
Output : Naivasha_NetworkExtraction

6. Operation – DEM hyroprocessing – Network and Catchment Extraction – Drainage Network Ordering
Input : Naivasha_NetworkExtraction
Output : Naivasha_ NetworkOrdering

Minimum drainage length:
Type a value for the minimum length (m) that a stream should have to remain in the drainage network. By choosing a larger value, fewer streams will remain in the drainage network; this will speed up the operation.
In this case, 300 m is the minimum length of the drainage created from the Network Extraction. It depends on which scale we were working on (personal opinion).
7. Operation – DEM hyroprocessing – Network and Catchment Extraction –
Input : Naivasha_ NetworkOrdering, Naivasha_FlowDirection
Output : Naivasha_CatchmentExtraction (polygon data,segment map).

8. Export Naivasha_CatchmentExtraction (polygon data) into *.shp format and open in ArcGIS.
9. Edit the drainage pattern and validate some of pattern which are not necessary using high image resolution (e.g Aster VNIR,Google Earth image etc)

ILWIS OPEN SOURCE

Good news for the GIS community, the ILWIS GIS Software from ITC (International Institute for Geo-Information Science and Earth Observation) has migrated to Open Source software under the 52 ° North initiative since July 1, 2007.


ILWIS was built as the Integrated Land and Water Information Systems, but this software is not limited to Natural Resource Management course. ILWIS can also be used for risk assessment and urban planning. For raster data users this is good news because in addition to its ability in GIS data processing but also good in the processing of raster data. Sautsagala even dare to say "ILWIS is very good in dealing with raster data but not so much for vector. ESRI ArcGIS does much better in vector based data but poor in raster "

Mosaicing (merge) Scene in ER Mapper Satellite Imagery

In analyzing such a large area of ​​province, the coverage consists of several scenes of his image, then before the scene if the image has been in the mosaic (combined) in advance. Mosaic image of the multi-band can be done in ER Mapper, a mosaic of data to be better with the Image Balancing facilities. The resulting image of the mosaic is later is a new data composites with a full band or in want.
Way Memosaic

Equate the projected image will be in the mosaic
Perform geometric correction using the larger the data vector, for example Polygon provincial boundaries. In correcting geometik, empowering also other data that you have such a data path, river, etc. because it will greatly facilitate the correction.
Open the data to be in the mosaic.
Right click on layer> change RGB layer into Pseudolayer> Adjust with each of his band. If what you want, is a mosaic of data in the form of a composite image, for example, the Composite 543, then that needs to be prepared pseudolayernya band only 5.4 and 3, whereas if it is in want is a multiband image mosaic is complete, then prepare its pseudolayer for each band.
Click the new window> Go to the next image data, proisedur do the same.
Click icon to copy and paste it all prseudolayer on image 2 below pseudolayer 1, fix the order by arranging pseudolayer be: band 1 (citra1), band 1 (image 2), band1 (image 3) and so on.
Enable menu sub menus Image Balancing Wizard, by clicking on the Icon Image Balancing Wizard for Air Photos, adjust the choice.
Next open the menu algorythm to adjust it by clicking on the Histogram icon Histogram Match.
To see the mosaic window right click on View> Quick Zoom> Zoom to All Datasets
If ok then save the image of a merged band. Do the same for all bands band.Selanjutnya combine this mosaic into the desired image.
Actually, ER Mapper ER Mapper application also provides an evaluation version of Image Compressor 30 days, the application can memosaic and compress the image into the format. ECW, has a user interface that is easily understood by the GIS-er and highly efficient click. However, this evaluation version can only save images with a maximum file size 50 MB, making it less suitable for use, the mosaic of Landsat 5 scene will be measured about 1.5 GB.

ER Mapper Image Compressor download

Other applications that are more specific to the data is memosaic ER Mapper Mosaic Image Balancing and Compressor (MBC), but until now not been available for free.

In addition to ER Mapper, generally other GIS software also has the function of mosaic. ER Mapper comparison with some other software that can be seen below:

ENVI
Mosaic and ortho-photo production. Hyper-spectral analysis. Integrated GIS and radar capability of data. Good import / export functions.
Erdas
Mosaic and ortho-photo production. Works with aerial photos and satellite images. Automatic DEM extraction, matching and color balancing and radiometric correction. IMAGINE product line compliments. Good import / export functions.
ER Mapper
Mosaic and ortho-photo production. Hyper-spectral analysis. Color matching and radiometric Corrections. 3D object creation. GIS functionality.
ESRI
Mosaic and geo-referencing. Image analysis available. Works with satellite, radar and photos. Compliments other ESRI products. Good import / export functions.
GRASS
Georeferencing and mosaic. Creates ortho-photos
Idrisi
Mosaic and geo-referencing functionality. Image analysis capability. No ortho-photo function. Most Widely used raster based GIS.
PCI
Works with airphotos, IKONOS and satellite imaging. Automatic DEM extraction, extraction and 3D RADARSAT satellite image extraction. Other modules available for hyper-spectral analysis and GIS functions. Color and radiometric correction.
MicroImages
Mosaic and geo-referencing. Image analysis capability. Accepts satellite, aerial photos and radar images. Ortho-photo capability. Good import / export functionality.

Register Map in ArcGIS Raster

Before a map / image raster scanning results such as maps or downloaded from the internet that can be processed in a Geographic Information System software, the first map should be on the register. Register on how ArcGIS desktop like this:

Open a raster map to be processed
Activate the Georeferencing Toolbars via Tools> Customize> Check on the Georeferencing
Choose at least 3 or 4 points on the line of intersection coordinates, note that in notepad decimal coordinates (decimal coordinates obtained from X and Y gridlines intersect). For raster maps typically coordinates in degrees, the first coordinate conversion to decimal degrees.
Click the Add Control Point icon and point it right at the intersection coordinates> right click and inputs X and Y, enter the coordinates of which are recorded on the notepad and click ok and the map has to be used for digitization.

Download the Registration Data and Data from Google Earth

We recommend using Google Earth and Google Earth Professional Logo Remover to download the data so there is no Google Earth Logo on the data downloaded.
Download Google Earth Pro 4.2 Fully Patched.

Open the desired area on Google Earth
Click Tools> Options> Change the Show Lat / Long to Decimal Degrees and Change units to meters
Click the Add Place Mark icon and replace the icon with a small box, drag it to the corner of the picture, name the Placemark: 1, record the coordinates X and Y on the notepad. Perform the three other corners. This is done so that the registration process will be more accurate.
Download the image by selecting File> Save Image> Select Premium on Image Resolution
Open Data in ArcGIS and do register as the registration of maps / drawings. Points that have been marked and recorded the coordinates on the notepad to the Control Point at the time of Georeferencing.
Registration can also be done in Mapinfo, ArcView, ER Mapper and Erdas.

Method Combining Landsat Bands in ER Mapper

When purchasing or acquiring the satellite image data often not incorporated and each band is still in a state separate. For example, Landsat 5 TM is separated into seven bands in GeoTiff format or img.
By combining them?

Open the first band to merge, copy pseudolayer by clicking on the icon copy and paste, rename it to band 1, 2, 3, 4, 5 and 7.
It fits each band with a tiff file on preliminary data, the opening through the layer on the algorithm> point on the band in question> Do not click OK select the This Layer Only.
Click the Edit icon Transform Limit> Choose Default Linear Transform> Limits> Limit To Actual.
Save as data in ER Mapper Raster Dataset format or. Ers in a format and save it as well. ALG

Transformation and the projection data in ArcView


In order to overlay vector data can be in ArcView, the data must have the same datum and projection. To equate the projections we can use the ArcView Projection Utility.
Open ArcView Projection Utility2. Browse and locate the data vector to be projected (could be more than one)> Click Next
Select Coordinate System Type, for example, for Indonesia select: Geodetic> Name: GCS_WGS_1984> Click Next> Finish.
Furthermore, the data can be in the overlay. To overlay vector and satellite images, adjust image and vector projection as well. Just a suggestion, so as not to be confused with the projection system only select one type of projection for your data, such as GCS WGS 1984, so that data can always be in the overlay each time it takes

Changing coordinates to Decimal Degrees

Changing coordinates to Decimal Degrees
When downloading data from a GPS or get the data coordinates in degrees, must first be converted into decimal form that can be opened in the software MapInfo, ArcGIS, etc.. The trick is easy, staying in the edit in Microsoft Excel like this:
Example: for X 101 27 '28.9 "
Degree + (min/60) + (sec/3600) = 101 + (27/60) + (28.9/3600) = 101.4608


Save the data X and Y and their decimal information in the format. Xls or. Tab and then can be directly opened in GIS software into the data vector

False Color Composite (FCC) for satellite image interpretation Visually with Erdas


FCC (False Color Composite / False Colour Composite) is a technique used to interpret satellite images visually, ie by modifying the composition of the spectral bands in the image. This can be done very easy and interesting in Erdas Imagine. We can easily change the contrast and change the Histogram Equalization using its menu enhancement.

A. Erdas Imagine Run> Open image
2. A little trick: On the Spectral menu instead of RGB becomes 543, and 453 as shown in the table (Actually, the composition is derived from the characteristics of the band's own image).

Creating a New Shapefile, calculate area, perimeter, Acre and Hectares XTools Using Professional

Creating a New Shapefile, calculate area, perimeter, Acre and Hectares XTools Using Professional
At ArcGIS we can add a very powerful extension is XTools Pro. We can easily process the data vector that we want, such as:
-Creating a new Shapefile
-Calculating the circumference and area
-Creating a polygon from polyline
Polygon-Sharing
-Exporting data into kml format
-Extract the map


Install XTools Pro, this version is a 30-day trial, so we have to reinstall again after 30 days. To activate, click Tools> Customize> Pro Tools> Check. To create a new shapefile, there are two ways you can do. The first is to click the icon to Add New Shapefile, and the second is by drawing polygons / lines are in want, then by using Convert Graphics to Shape

Projection and Datum Transform Satellite Imagery with Erdas View Finder

Before me mosaic image data or perform further analysis, we must equate the projected image data that we have first. Sometimes confusing when the image that we will not overlap with the true mosaic, even though such applications and Er Mapper ArcGIS already on the fly (it opens a different coordinate system and to overlaykannya), will greatly facilitate when we have data same projection system. There is an application of the name Erdas Erdas View Finder 2.1 which can mereprojeksikan back image data quickly and easily,

Download Erdas View Finder

Thing to do is open the image data to be in reproyeksi
Save as> Output Type a name and location images, data can be saved in. IMG and GeoTIFF
In the Output File Options tab, check the Change Output Pixel Size, and fill with the desired data and also check the Change Output Projection and Select in accordance with the datum and projection desired.
Click Ok, the output data is data that has been direproyeksikan.
That it should be noted that this application is only projecting the data that already has a projection system, rather than defining the projection.
In addition to mereproyeksikan data, there are many other functions of this application, such as:
Support. IMG, TIFF, GeoTIFF and MrSID format
Display and enlarge the range of scales. Several different images can be displayed simultaneously on the view finder window.
Mengoverlay, open the query, measure, and the sharp contrast of the image display.

Radiometric correction of Landsat images using ENVI 4.x

ENVI ® (the Environment for visualizing Images) is a revolution of digital image processing system. From the beginning of the birth, ENVI has been designed for many specific requirements on who typically use satellite remote sensing data or aerial photographs. ENVI provides data visualization and comprehensive analysis for the image in any size and any type of environment in which innovative and user-friendly.


Atmospheric correction performed on the radiometric image is distorted. Or to say also that the radiometric correction performed due to interference from atmospheric effects as the main source of error. Distortion can occur during data acquisition and transmission or recording of the detectors used in the sensor with the characteristics of errors include: - The existence of the missing pixels - Effects of the atmosphere that causes the shadow scattering object - The appearance of lines caused by the lack of uniformity detectors Correction of the above can use the histogram adjustment method (histogram adjustment). The assumption underlying this method is the lowest pixel value of each channel should be 0. If the value is greater than zero (> 0), then calculated as the bias or offset, and the correction is done by removing the bias, which reduces the overall value of the original spectral channels with a value bias respectively. In ENVI Band Math can be performed with or Dark Substract Basic Tools> Band Math then enter the formula Reduction of the bias, for example: B1-54 done for each band, with each value of bias Basic Tools> Preprocessing> General Purpose Utilities> Dark Substract select the image, then all bands will be corrected (if any bands / channels are in one file) To check the value of vulnerable band / channel Select Basic Tools> Statistics> Statistics Compute

Change Detection, different from the data, should Geometric Correction


Change Detection, different from the data, should Geometric Correction? The answer, already barangtentu need (said the so and so); as it is unlikely we will get results as expected if two different data (in this case the satellite remote sensing image data) is done for analysis / detection of changes. Case in point, the data used is the 1972 landsat mss compared with Landsat TM imagery in 2006. Is it still necessary geometric correction? In terms of spatial resolution, of course, different where the landsat mss has a spatial resolution of 60 meters while Landsat TM has a spatial resolution of 30 meters. But let's try to examine the geometric side of the first. Please observe and study the picture above and give advice or answers to questions.

GPS: Marking and Tracking...

Global Positioning System is a tool to determine the position in a particular coordinate system. The first system was developed by the U.S. to put a few tens of satellites in the sky spread out the earth in a satellite constellation system. Want to know how to save the location and the journey we went through with the GPS? http://gisresetutor.blogspot.com/2010/01/tutorial-gps-

global-positioning-system.html GPS Track and Mark E-book is entitled: Track and Mark location with GPS 76CSx Authors: A. Anam Pages: 11 this E-book discusses the introduction of GPS 76CSX, GPS calibration, tracking the journey, and mark (recording position) waypoint. Attachments (1) TRACK AND LOCATION WITH MARK GPS.pdf - on Dec 29, 2010 11:35 AM by Community GIS (version 1) 243k View Download

Band Ratio dengan ArcGIS

Band Ratio is the ratio between bands or simple language is the division between the band x and band y. Usefulness for the band ratio is so large, it can be to highlight the object of vegetation, water and the boundary between land and sea.Band Ratio is a method of transformation of digital remote sensing image. Can usually be done by using software or software for digital satellite image processing, such as ENVI, Erdas and ERMAPPER and other software.On this occasion, Landsat satellite imagery that consists of a number of channels which exist among the channel 5 and channel 2 which is which, if treated with the band ratio method. Namely the band ratio 5/2 = band band 5 divided by 2 can be used for the extraction of information or analysis of shoreline beach dynamics change when we use satellite imagery and multitemporal Landsat band ratio mengoverlaykan results with other channels to see the dynamic changes that occur.

This method is easy tentusaja applied in the digital satellite image processing software, even the band ratio method is in the softwate with ENVI Zoom ENVI was used as one additional option in the process of automatic feature extraction. Or the process is pretty well known now as one way of satellite image classification based on the object that is object-based classification.In addition to the software, the band ratio method is tentusaja can be done in the geographic information system software is updated from the ESRI ArcGIS 9.x Where it has been said in the ArcGIS version 10, toolboxes for image processing digital satellite has separated itself and prepared alias tentusaja this challenge of integration between GIS data with image processing software or a remote sensing satellite image data.Who reviewed this time is the band ratio method with ArcGIS 9.x versions, namely through the toolboxes with tools and Map Algebra Spatial Analyst raster calculator that is.

Play with Model Builder

Geospatial data modeling is very helpful to use the Model Builder in the output of ESRI GIS software. Both of when using ArcView GIS 3.x version and now when using ArcGIS version 9.x (now out version 10). A simple example: we can do overlapping stacking multiple layers of data (rainfall, slope and soil) using INTERSECT tools that can be dragged into the model builder and running, so the output of the overlay layer. The results of this overlay stages still need

calculate total scores and attribute query to select and determine the direction of the function of land use classes. Then we can drag tools: dissolve polygons to simplify the results. Further, please explorasikan yourself with the existing toolboxes and make new automation tools-tools for modeling what you want

Download and Save Google Earh Images using ELshayal Smart GIS

Download and Save Google Earh Images using ELshayal Smart GIS

Start on question, how to download images from Google Earth and how to rectify?

Then we can found in ELshayal; there is a FREE version 4.35 New Features.

1. Download and save Google Earth Images as rectified images with world file format .jgw
2. Save the output layout images as rectified Images.
3. Open and Convert NASA (ASTER & SRTM) DEM to Tin shape file

The Last version is available for free at
http://download. cnet.com/ Elshayal- Smart-GIS- Map-Editor/ 3000-18496_ 4-10922171. html

Great and Salute for Mohamed Elshayal
Elshayal Smart GIS Map Editor

ArcGIS Data Interoperability di ArcGIS 9.2/ArcGIS 9.3


ArcGIS Data Interoperability extension provides direct access to dozens of spatial data formats, including GML profiles, DWG / DXF file, Microstation ® design files, MapInfo MID / MIF files, and file type TAB. Users can drag and drop these and many other external data sources to ArcGIS for immediate use in mapping, geoprocessing, metadata management, and use a 3D globe. For example, you can take advantage of all the mapping function available to the original data in ESRI ArcMap format for these data sources - such as seeing the features and attributes, identifying features, and make choices.ArcGIS Data Interoperability extension is developed and maintained jointly by ESRI and Safe Software Inc., a leading GIS vendor interoperability, and are based on popular software products that feature Manipulastion Safe Engine (FME ®).ArcGIS Data Interoperability extension is also included which contains a series of FME Workbench tools / data transformation tools to build a converter for many formats of vector data.With ArcGIS Data Interoperability extension, users can:Ø Adds support for many GIS data formats for direct use in ArcGIS, for example, for use in ArcMap, ArcCatalog, and geoprocessing.Ø Connect to and read a variety of common GIS formats-for example, TAB, MIF, E00, and GML, and many database connectionsØ Define the complex, data semantic interpreter using FME WorkbenchØ Manipulate and combine many of the attributes of data tables from a variety of formats and DBMS's with featuresØ Export classes for each feature more than 50 output formats-for example, export to GML, and create advanced translator for customizing the output format.Using ArcGIS Data Interoperability Extension adds support for a variety of additional GIS data formats, and also provides FME Workbench that allows you to specify additional format that can be used to directly access and use data in ArcGIS.Exercise 1. We can directly see or read the data interoperabilityPlease run ArcCatalog, and look for a file with format *. MIF on the data you have, or from data ArcTutor. Click the Preview tab in ArcCatalog to view the data format *. MIF or other formats (dwg, dxf, etc.).Exercise 2. Connection InteroperabilityIn the Catalog Tree select the Interoperability Connection dialog box will appear, please select the format and dataset and set the settings and define the coordinate system. Then click OK, then it will appear on the Interoperability Connection Connection to the data.Exercise 3. Please drag or open a data Exercise 1 and Exercise 2 in ArcMapExercise 4. Translating Data Using Quick Import and Quick ExportUse ArcToolbox - red bag - red bag to bring tools Data Interoperability: No Quick Export and Quick Import.Exercise 5. Quick Import and Quick Export in Model BuilderYou can drag and QE QI tools into the Model Builder that we make.

Global Positioning System surveys

Global Positioning System surveys with such titles contained in a digital textbook book is published in the GIS Community by PT. Geovisi Mitratama. The series of books in gif format which can be downloaded in the GIS community mailing list. The following excerpt from the Introduction to the eBook contents of the GPS: Global Positioning System is a tool to determine the position in a particular coordinate system. The first system was developed by the U.S. to put a few tens of satellites in the sky spread out the earth in a satellite constellation systm. The book is a training in the use of GPS by Garmin series type III / V, which is divided on which is technically the use of GPS which includes: A. The introduction of satellite layer and the minimum requirement satellite 2. Obtaining coordinates 3. Setting the datum and coordinate system 4. Tracking using GPS track-log 5. Storing data, name data, display data 6. Importing data using GPS MapSource software, convert the data into a spatial data format to another. Here are excerpts from the gif image or tutorial module GPS usage is:

Spatial Adjustment


ESRI, 1990, defines GIS as an organized collection of computer hardware, software, geographic data and personnel designed to efficiently acquire, store, update, manipulate, analyze, and display all forms of geographic referenced information.Spatial Adjustment is one of the facilities in the ArcGIS 9.x softwareAdjustment in ArcGIS Spatial provides three types of transformations are: affine, similarity, and projective.Affine transformation can perform differential scaling, skew, rotation, and translation on the data. Affine transformation requires a minimum of three displacement links.Scale a similarity transformation, rotating, and translating the data while maintaining the aspect ratio of the transformed feature. Similarity transformation requires at least two displacement links.

Projective transformation based on a more complex formula that requires a minimum of four displacement links:x '= (Ax + By + C) / (Gx + Hy + 1)y '= (Dx + Ey + F) / (Gx + Hy + 1)This method is used for the transformation of the data obtained directly from aerial photography.In addition to the above transformation method, there is also another method of adjustment and the rubbersheet edgesnap.Rubber sheetingGeometric distortion in general override the source maps. Can be caused by imperfections in the registration, the lack of geodetic control on the source data, or other causes. Rubber sheeting coordinates with the geometric error correction adjustment.EdgematchingEdgematching process set features along the edge of one layer to layer features of the adjoint. Layer is less accurate in-adjust, and the other layer as a control.There is another facility associated with the attributes of the data to adjust ...Attribute transferAttribute transfer is usually used to copy the attributes of the layer of detail to be less accurate or more accurate. For example, is used to transfer the name of the hydrology of the map feature digitization and generalize the results to a map scale of 1:500,000 scale 1:24,000.In ArcMap, you can specify the attributes you want to transfer between the layers interactively by selecting the feature source and target.

ArcGIS Spatial Analyst A very powerful tool used to perform spatial analysis

: Used to: Derive Information, Spatial Relationships Identify, Find Suitable Locations, Calculate Cost of Travel ArcGIS Spatial Analyst helps us to be able to do: Surface analysis Surface Analysis tools useful in lowering the height of geospatial information from the data, such as § Slope § Aspect § Hillshade § Viewshed Surface creation Surface Analysis tools have the tools to make the surface interpolation of sampled data measurements.

§ Spline § Inverse Distance Weighted § Kriging (Ordinary, Universal) raster calculation À Raster calculator to incorporate a variety of datasets with specific parameters Raster calculator is also a tool for: § Calculating map algebra § Map functions § conducting queries Distance Analysis Can provide information such as: § The distance to the nearest hospital at a given location. § Find all the restaurants in particular locations. § shortest or least cost path from one location to another

Landsat data processing for the identification of the shoreline using ER Mapper and ENVI

basically through two stages of the processing of initial and core processing. This initial processing of Landsat Data using ENVI 4.0 software to be made into a single dataset band 245. Then the next stage of processing is the core using ER Mapper 6.4 software with the formula if (i1/i2)> = 1 then 1 else if (i3/i2)> = 1 then 1 else 2. The second reason the use of such software is a habit and convenience of the writer who combines the ability of both to digital image processing. data extraction Extract the file to Landsat band 2, band 4 and band 5, which has been successfully downloaded


Save the band 2.4, and 5 into a single datasetOpen the software ENVI 4.0Choose Open External File -> Generic Formats -> TIFF / GeoTIFFChoose a file at a time band 2, 4, and 5 -> OpenAll files will appear in the Available Bands List, and then save the three bands into one file ENVI Standard.Select the files that will be used into a single dataset. In the New File Builder, choose File Import ...Select all the files which files band 2, band 4 and band 5, and then click OK.Sort files of band 2 as the first band, band 4 as the second band, and band 5 as the third band.Select the Reorder Files ..., then click and hold while moving the band 2 to the first position, followed in second place band 4 and band 5 in the third position.After completion sorted filesnya band2, 4.5 on the Reorder Files ... and then click OK.Save files (for example, by name: p125r060_b245), and then click OK.Statement giving the name of files: p (path number) r (row number) _b245 -> naming it to help us.The process of making new files in progressThe new files will appear in the Available Bands ListExport data to a format ER Mapper FileSave the new files into a dataset band 245 ER Mapper data format, for subsequent processing will be done using ER Mapper software. REMEMBER! that the dataset files the first band is the band 2, band 2 is band 4 and band 3 is a band 5.Select the files datasets 245 band, and then click OK.Write the names of files, add er (eg: p125r060_b2445er) in the name of the files that already exist to facilitate us.Wait for the process is complete, then we can close the software ENVI 4.0Data Processing Using the ER Mapper 6.4Open software ER Mapper 6.4Click on the icon (Edit Algorithm) in the ER Mapper main menu and the second window will appear with the name: 'Algorithm not yet saved' and the 'Algorithm'Click on the icon (Load Dataset) on the Algorithm window to open the file p125r060_b245er.ers (Open the dataset file containing the data band 2, 4 and 5).Show image with transformation Histogram Display OnlyIn the Algorithm window, click (Edit Transform Limits) on the right.Transform visible window.Note: for this step, make sure that only shows the first layer and the layer is in a pseudo layer and the color table and color in the pseudocolor mode.Click (Edit Formula), and the Formula Editor window will appear.Note: If the formula has been there, click File / Open the Formula Editor window, then to the directory where the formula is stored.Note that: INPUT 1 = select band 2,INPUT 2 = select band 1, andINPUT 3 = select band 3REMEMBER! that: 1 band is a band Landsat 2 data, band 2 is band Landsat 4 data, and band 3 is the band Landsat 5 data.If not: In the Formula Editor window enter the following formula:if (i1/i2)> = 1 then 1 else if (i3/i2)> = 1 then 1 else 2Click Apply Changes ..Click on Close.Make sure all transform in a state Histogram Display Only.Click the icon (Save As) and the Files of Type, select ER Mapper Raster Dataset (. Ers)Type to Output Dataset: p125r060_b245er_land.ers (name up to an important easy to remember)Then click OK. Save As window will appear ER Mapper Raster Dataset, the Data Type, click Unsigned8BitInteger, click OK.Status window will show the percentage of the process.Checks Processed Files Results Identification MainlandOpen the file processed p125r060_b245er_land.ers.Then click on the histogram algorithm, to adjust the value of the histogram data to the actual value that is owned by the data processed (ie, the value of DN (Digital Number) = 1 and 2).Select à Limits Limits to Actualwill display the data that has been processed to distinguish land and sea

LANDSAT DATA PROCESSING INSTRUCTIONS ER-Mapper 6.4 USE FOR sediment

A. Open-ER Mapper 6.4, can pass the desktop icon, or from the Start menu  All Programs   ER Mapper ER Mapper 6.4 2. Click on the icon (Edit Algorithm) in the ER Mapper main menu and the second window will appear with the name: 'Algorithm not yet saved' and the 'Algorithm' 3. Click on the icon (Load Dataset) on the Algorithm window to open the file b12345.ers (Open the dataset file containing the data bands 1 through 5). 4. Show image with transformation Histogram Display Only In the Algorithm window, click (Edit Transform Limits) on the right. Transform visible window. Note: for this step, make sure that only shows the first layer and the layer is in a pseudo layer and the color table and color in the pseudocolor mode.

Click (Edit Formula), and the Formula Editor window will appear. Note: If the formula has been there, click File / Open the Formula Editor window, then to the directory where the formula is stored. Note that: INPUT 1 and INPUT 2 = band3 = band2 If not: In the Formula Editor window enter (Formula You Yuming and Min Hou, 1990): Pow (10, (0.89 + (1,755 * (INPUT1/INPUT2)))) Click Apply Changes .. Click on Close. Click the icon (Save As) and the Files of Type, select ER Mapper Raster Dataset (. Ers) Type to Output Dataset: landsat_sedimen.ers (name up to an important easy to remember) Then click OK. Save As window will appear ER Mapper Raster Dataset, In the Data Type, click the IEEE 4 byte real, click OK. Status window will show the percentage of the process. 5. SPL from the calculation using Formula You Yuming and Min Hou, 1990 looks the resulting value is the value of the Digital number (DN = Pixel value). Open the file landsat_sedimen.ers processing results. Click, click Limit to actual

IMAGE PROCESSING INSTRUCTIONS AQUA / TERRA MODIS WITH ENVI 4.x MODIS HDF FILE OPEN IN SOFTWARE

ENVI 4.x Ingredients: AQUA MODIS / TERRA Level 1B 1km Resolution 1.Jalankan ENVI program Modis image 2.Membuka Level 1B 1km resolution, click File  Open  Generic External File Format  HDF 3.Arahkan the image storage location and select the image of fashionable level 1B, for example MYD021KM.A2007273.0630.005.2008036145630.,

And then click Open 4.Memilih that ".... Scaled Integer", then click OK 5.Pilih BSQ, and then click OK 6.Pilih BSQ again, and then click OK 7.Selanjutnya avalaible on menu list will appear 36 bands bands 8.Tahap subsequent image processing is still needed both in the geometric correction, radiometric correction and bow tie

The image sharpening Image enhancement with ERMAPPER

process done to facilitate the user in interpreting the existing objects in the image display. With the algorithm, ER Mapper allows users perform a variety of image enhancement process without the need to create new files that will only make a full disk of the computer. The types of image enhancement operations include: Merging Data (Data fusion), combining images from different sources in the same area to assist in the interpretation. Examples of Landsat-TM with SPOT Data. Colodraping, put one type of image data over other data to create a combination view, making it easier to analyze two or more variables.

Examples of satellite imagery in colordraping vegetation on the aerial photo image in the same area. Contrast enhancement, improving image appearance by maximizing the contrast between light and darkening or raising and lowering the price of an image of the data. Filtering, improving image appearance by transforming the digital image values​​, such as sharpening the border area mempeunyai the same digital value (enhance edge), smoothing the image of the noise (smooth noise), etc.. Formula, made ​​a mathematical operation and enter the values ​​in the digital image of the mathematical operation., Such as Principal Component Analysis (PCA). Classification, showing the image into certain classes are statistically based on the digital value. Example create land cover maps from Landsat-TM satellite imagery.

Data rectification / geocoding

Data rectification / geocoding Raster data is generally displayed in the form of "raw" data and has a geometric error. To obtain accurate data, the data must be corrected geometrically into the earth coordinate system. There are two geometric correction process: Registration, geometric correction of images that have not been corrected with the image that has been corrected.

Rectification, a geometric correction of images with maps The image mosaic Mosaic image is the process of combining / attaching two or more images that overlap (overlapping) so as to produce a representative image and continuous. ER Mapper in this process can be done without creating a large file, except when we want to keep a separate file.

Showing Image in ERMAPPER

After importing the data, then the display image. This is done to determine the quality of data used. If the data / image quality is not to your liking (cloudy, data is striped, etc.) then we do not need to continue the treatment process, and look for new data that has better quality. In the ER Mapper, how to display the image called the Color Mode. There are several ways to display the image: Pseudocolor Displays, display the image in black and white,

usually only consists of one layer / band only. Red-Green-Blue (RGB), display the image through a combination of three bands, each band is placed on one layer (Red / Green / Blue), this method is also called composite color. Example: False Color Composite RGB 453. Hue-Saturation-Intensity (HIS), display the image through a combination of three bands, each band is placed on one layer (Hue / Saturation / Intensity), this method is usually used when we use two different kinds of data, eg the data with Landsat-Radar TM.

Image Processing Procedures

The procedure begins with the image data processing import data up to the final result in print (printing). Of some of these procedures, not all procedures must be performed to obtain results in line with expectations. For some applications the expected output can be generated without going through the whole procedure of image processing. import data The first step is to import the image processing of satellite data to be used in ER Mapper format. Generally, the data stored in the form of magnetic tape, CD-ROM or other storage media. Two main forms of data are imported into the ER Mapper is a vector and raster data. Raster data is the data type that is the primary activity of image processing. Examples of raster data is satellite imagery and aerial photography.

At the time of import raster data, ER Mapper will create two files, namely: Binary data files containing raster data in BIL format, without the file extension. Header file in ASCII format with the extension. Ers Vector data is data that terseimpan in the form of lines, points and polygons. Examples of vector data is the data generated from the digitized Geographic Information System (GIS) such as roads, location of sampling or administrative boundaries. ER Mapper also will create two files are the result of importing vector data: Data files in ASCII format containing vector data Header file in ASCII format with the extension. ERV

Banish Mosquitoes Use GIS (Global information System)

Because of thick smoke shrouded the house smelled of kerosene, I idly looking for information about fogging and various measures of environmental health management. Garanya because of the mosquitoes, but fogging is ineffective or lethal eggs jentiknya. Indeed, fogging is not recommended actions, or in other words, fogging becomes the last resort when there is an epidemic in a region. Although annoying, the end must direlakan in-house fogging, the residents were "kicked out" while while my nose.


WHO says some programs that include prevention and penangahan: Chemical treatment of breeding sites, Biological control, insecticide spraying, Environmental management and vector control, and community mobilization. The most effective follow it along to maintain awareness of environmental health. It is precisely here that Indonesia is still left behind. Movement "3M Plus" - the Closing, Draining, Burying, and use trusted anti mosquito - a campaign not only limited to the ongoing massive movement. Yet to this fogging problem, officers in the field sometimes ignore the standards and procedures established by the fogging of the health department or clinic that would refer to the WHO standard as well.


About the handling of mosquitoes or the treatment of dengue fever, it is better to learn from Singapore. To prevent the spread of mosquitoes, Singapore using an integrated approach to evidence-based approach that includes sectoral collaboration, public education, community services, law enforcement, and research. Various studies and research results were published regularly

Detection of Urban Heat Island (the urban heat island) with remote sensing data


The process of urbanization that occurred in large cities to result in an increase in the population. As a result of the urbanization process is the existence of land-uses of land not built to land up. The impact of process-quality urbaniasi environmental conditions in addition to affecting change is the microclimate in which the conditions of urban air temperature is higher than the surrounding air temperature (Lo and Quattrochi, 2003; Chen et al., 2006). This phenomenon is often referred to as the Urban Heat Island effect (UHI). UHI is a phenomenon or event increase in air temperature in urban areas compared to the surrounding area up to 3-10 ° C. This condition is caused by objects in the urban areas is largely a land up, and materials that are waterproof generally will result in absorption of heat capacity and high thermal conductivity. According Tursilowati (2007) building materials such as asphalt, cement, and concrete absorbing and storing solar heat. Coupled with the use of heating, air conditioning, and power plants that generate waste heat.UHI is formed if the majority of plants (vegetation) is replaced by asphalt and concrete for roads, buildings and other structures necessary to accommodate the increasing human population. Surface soil was replaced to absorb more solar heat as well as more reflecting, causing surface temperatures and the ambient temperature rises. Replacement of shrubs and trees causing shelter and exchange of air through evapotranspiration is reduced so that more humid air is lost (Nowak, 2000).The study of the UHI is very important because it affects the air quality, human health and affect energy use. An increase UHI is also one of the factors that cause global climate change. In this study performed the analysis using remote sensing data and geographic information systems. Advantages of remote sensing in providing spatial data accuracy as well as meetings with a wide range of areas has been demonstrated by Lo et al. (1997), Streutker (2002), and Chen et al. (2006).

All the studies reveal the potential use of remote sensing to analyze the phenomenon of UHI get good results and accurate, although it must be supported by field observation data at climatological stations as reference data. Limited number of conventional weather stations are spatially can be covered with the use of remote sensing.Utilization of data to detect distant pengideraan urban surface temperatures have been carried out in many places and regions. The main basis of the utilization of remote sensing data is the ability to provide data of land surface temperature (land surface temperature) for a wide area and with a high level of data kerapan (1200 m2). This situation can only be done by remote sensing data. However, as detected by remote sensing data is land surface temperature (the object that is on the surface of land) and NOT the air temperature at the surface. The first study on UHI with remote sensing data is done by Rao (1972) by using a sensor Scanning Radiometer (SR), which has a spatial resolution of 7.4 km that is on-1 satellite ITOs in New York City, USA and beyond. Furthermore Carlson et al. (1977) and Matson et al. (1978) continued the study with a more detailed satellite spatial resolution (1 km) in Los Angeles and Washington. The results of the analysis concluded that remote sensing data can be used to examine the effect of UHI in urban areas.After these studies, the utilization of remote sensing data for mapping of UHI area continues to grow. With the remote sensing data with a more detailed spatial resolution such as Landsat and Aster causes the UHI more detail the detection region. Liu and Zhang (2011) using Landsat and Aster to see the UHI in Hong Kong, Streutker (2002) only make use of NOAA Advanced Very High Resolution Radiometer (AVHRR) in the study of UHI in Houston, Texas; and Chen et al. (2006) make use of Landsat 5 and Landsat ETM + to detect the effects of land use change on UHI to correlate with indices of remote sensing. In Indonesia, Tusilowati (2005) tried to assess changes in land use in urban temperature changes in Bandung and Bogor. In addition, Tursilowati (2007) also examines the UHI in the three other major cities, namely Bandung, Semarang and Surabaya. While Effendy (2007) studied the effects of green open spaces of the UHI phenomenon in the greater Jakarta area.The incorporation of remote sensing and GIS analysis in studies of the UHI been done by Aniello et al. (1995). The results of the analysis show that the incorporation of a GIS can clarify the distribution of the location of UHI. On the other hand, Lo et al. (1997) utilize data from the thermal infrared sensor to study the UHI aircraft and mengabungkannya with GIS to obtain more detailed information. In theory the GIS is helpful to clarify the distribution of the location of the UHI through additions to the GIS data layers such as data paths, streams and distribution buildings. by combining remote sensing data and GIS is expected to provide precise information of the spatial distribution of UHI sector in the region.

Plane crashes in Nigeria Dana Air, has been found more victims of Indonesia

Engineer Supervisor Dana Air, Faisal, said that it still continues to seek repatriation of the bodies Widyo Utomo, Dana Air plane crash victims. In addition to repatriation corpse, he also akan ensure the rights of victims could be fulfilled. "Our bodies try to return as soon as possible. Tonight I will go to Lagos, Nigeria to see the condition of the victim and assist in repatriation of the bodies," said Supervisor Engineer Water Fund, Faisal, told AFP on Wednesday (06.06.12).

According to Faisal, in addition to the return of the bodies, it also will return all personal belongings of victims in Nigeria. "Later appointed to deliver the body to depend on the company in Indonesia. But in addition to the return of the bodies, belongings Widyo also been packed since yesterday, and ready to be returned to the family," he said. He explained that the Water Fund will also seek to restore the rights of victims to the family, such as salaries and insurance. "If the rights of victims, depending on when the body is ready to be discharged, company will fulfill the rights of victims," he said. "Therefore there Kemenlu (Nigeria) continue contacts with the Foreign Ministry here, if there is nothing to live for help," he added.

source : www.detik.com

Wow! 6.5 Million Password Hacker compromised LinkedIn

LinkedIn exposed to the issue of system security. This was after the emergence of a report which said that 6.5 million professional social networking account password has fallen into the hands of hackers. Reported by TheVerge and quoted on Thursday (7/6/2012), the Russian hackers mentioned burglary was behind the action. "Users in online forums have been breaking the Russian claims LinkedIn and capture nearly 6.5 million account details," he wrote.

In fact, these users also upload a password that has been stolen, but without a username. "It is not known with certainty whether the offender also stole username LinkedIn users, but also seems to have downloaded the perpetrators," said TheVerge. LinkedIn is a social network for professionals. This site has around 161 million users and is available in 200 countries.

SOURCE : www.detik.com

Plane crash Nigeria Have No Water Extinguish Fire

Dana Air rescue aircraft that crashed in Nigeria is difficult. The cause is not no water around the scene to extinguish the fire. Rescuers acknowledged the difficulty getting water to evacuate the plane in Nigeria Dana Air, also hit a building owned by residents in Lagos. Local residents who helped firefighters bring the water hose, it was realized that no water can be used to extinguish the flames of the fire after the collapse of Boeing MD83 aircraft types it. For three hours they could not get water to extinguish the fire. In the end, people take their own initiatives to take water with buckets. They were trying to extinguish the fire with a modest strength. The situation was exacerbated by several fire trucks are not carrying enough water. Many trucks were deployed, but most of them trapped in the narrow and crowded streets by a crowd of citizens, in the end could not touch the truck scene. Plane crash that occurred on Sunday, June 3, killing all 153 passengers and a few others on the ground. When an accident occurs, the plane was headed for the city of Lagos after takeoff from Abuja. President Goodluck Jonathan declared a day of mourning for three days after the accident occurred.

"May the families of the victims are given the strength in dealing with their loss," the statement by President Jonathan told the Associated Press, Monday (06/04/2012). The incident was a blow to the aviation Nigeria. Earlier on Saturday, June 2nd and then a cargo plane owned by Nigeria's Allied Air Cargo, falling in Ghana. The plane hit the bus and killed 10 people. Accidents in Lagos this time is the worst seen since last September 1992. At that time a military aircraft crashed into the swamp after taking off from Lagos. The incident killed 163 members of the Nigerian military.

Voom! The plane crashes in the door Golf Course

U.S. aviation safety authorities are investigating the cause of the escape door of a private jet yesterday. Luckily, no casualties when the door flew and crashed on a golf course. Jet Canadair CL600 was traveling from Opa-Locka to Pompano Beach, Florida. Along the way, said Federal Aviation Administration spokeswoman Kathleen Bergen, a plane was diverted and landed safely at Fort Lauderdale-Hollywood International Airport.

"The aircraft exit the runway and had been delivered to Bombardier Aviation (maintenance facility at the airport) after it was discovered that the main cabin door apart," he said. Door, with a ladder mounted on the side of it, hit a tree before being thrown into a golf course near Hallandale Beach, according to WSVN-affiliated media on CNN. Golf course was closed at that time. This aircraft N207JB numbered identification. The same number had used a similar plane woe in 2009, according to the U.S. National Transportation Safety Board.

NIGERIA 147 AIRCRAFT FALL DEAD DANA AIR

There are no survivors among the 147 people who were in a domestic passenger plane that crashed in the city of Lagos, Nigeria, on Sunday said an official of the National Emergency Management Agency (NEMA), told Reuters.  The plane, operated by private airline Air Fund, was on a flight from Abuja, the capital of Nigeria, when fall hit a two-storey building in poor areas in Lagos, officials and witnesses said. Thousands of people thronged around the location of the wreckage of black smoke on the outskirts of Agege, Lagos. Witnesses said they saw the plane hit a building and burst into flames. Some people are stunned, while others took pictures with their camera phones at the crash site, in a region where the tin-roofed houses lined the road looks muddy.

Water Fund officials and civil aviation authorities have not provided a statement regarding the accident or the victim. Air accidents are common in Nigeria, a country with the second largest economy in Africa which has a poor record on aviation security. President of Nigeria Goodluck Jonathan announced three days of national mourning after a plane crash on Sunday. Jonathan "declared three days of national mourning for all those who died in a plane crash in Lagos Air Fund today," his office said in a statement. "President Jonathan, the government has canceled all events scheduled to take place tomorrow, also ordered the flying of flags at half mast Nigeria for a three-day mourning period," the statement said. "The president has also ordered a thorough investigation of the accident," he added.Urungkan pengeditan

NAMES VICTIMS OF JET AIRCRAFT SUKOI 100 has been identified

Hard work Vitctim Disaster Identification team (DVI) and Indonesia Automatic Identification System Identication Finger Prints (Inafis) Police Headquarters in identifying all the victims of the Sukhoi Superjet 100 airplane crash finally paid off.Exactly 12 days after the accident on Mount Salak SSJ Wednesday (09.05.2012), the 45 identified passengers finally finished today, Sunday (20/05/2012).This was disclosed during a press conference at Anton RS Police Bhayangkara, Kramat Jati, East Jakarta. Here's a list of the names of the victims of SSJ 100:A. Donardi Rahman, Male, (Aviastar).2. Nur Ilmawati, Women, (SKY).3. Edward Maraden Panggabean, Male, (Indoasia)4. Femi, Women, (Bloomberg News).5. Arman Zuvianto Ganis, Male, (Indonesia Air Sport).6. Darwin Pelawi, Male, (Pelita Air).7. Kornel M Sihombing, men's groups, (PT DI).8. Anton Daryanto, male, (Indonesia Air Sport).9. Herman Sulaji, Male, (Air Maleo).10. Stephen Kamachi, Male, (Indo Asia).11. Aditya Recodianty, Women, (SKY).12. Ade Arisanti, Women, (SKY).13. Dody Aviantara, Male, (Space Magazine).14. Educate Yusuf Nur, Male, (Space Magazine).15. Yusuf Ari Wibowo, Male, (SKY)16. Edie satrio, Male, (Pelita Air).17. Heyder Bachsin, Male, (PT Prima Power Chess).18. Kamaruzaman Salim, Male, (SKY).19. Henny Stefani,

female, (SKY).20. Charles Peter Adler, Male, (Srivijaya).21. Insan Kamil Djatnika, Male, (Indoasia).22. Billy Purwoko, Male, (Airfast).23. Raymon Sukanto, Male, (SKY).24. Fazal Ahmad, Male, (Indoasia).25. Darmawan Rully, Male, (Indoasia).26. Susana Vamella Rompas, female, (SKY).27. Aditya Sukardi, Male, (Trans TV).28. Maysyarah, female, (SKY).29. Arief Wahyudi, Male, (PT Trimarga Rekatama).30. Santi, female, (SKY).31. Ismiyati, female, (Trans TV).32. Mary Marcella, Female, (SKY).33. Capt. Aan Husdiana, man. (Kartika).34. Rosy Witham, woman, sky35. Intan Mutiara Dewi, female, (SKY).36. Anggraini Fitria, female, (SKY).37. Thonam Tran, Male, (Snacma / France).38. Eugeny Alexandrovich Grebenshchikov, Male, (Sukhoi).39. Kristina Nikolavna Kurzhupoza, female, (Sukhoi).40. Nikolay Dmitrievich Nartyshchenko, Male, (Sukhoi).41. Alexey Nikolaevich Kirkin, Male, (Sukhoi).42. Alexander Nikolarvich Yablonstev, Male, (Sukhoi).43. Alexander Pavlovich Kochetkov, male (Sukhoi).44. Denis Valerievich Rakhimov, Male, (Sukhoi).45. Oleg Vasilevich Shvetsov, Male behavior, (Sukhoi).Reported previously, the flight made Sukhoi Superjet 100 is part of the demo flight organized by PT Trimargarekatama. The company is an agent who introduced the Sukhoi aircraft from Russia to the company's flights in
Indonesia.Known, the plane was doing twice as much joy flight. The first flight from Halim Perdanakusuma to the Port of the Queen on Wednesday (9/5/2012), at 12.00 pm with the passenger business in the field of aviation. After flying about 35 to 45 minutes, the plane returned to Halim Perdanakusuma in good condition.A second flight at 14:12 pm with transporting 45 people, eight of whom are citizens of the Russian crew, a U.S. citizen, a citizen of France and the rest of citizen of Indonesia.At 14:33 pm, the plane lost contact and was later known to fall on the slopes of the mountain cliffs Salak, Bogor, West Java

Plane Crash in Nepal, Nine Killed

Back plane crash occurred on Monday (14/5) at an airstrip in the Himalayas, northern Nepal. The accident killed at least nine people and left eight others critically victim. Head of Government Administration of Northern Nepal Laxmi Raj Sharma, said the plane berpenumpang 21 people crashed into the mountain during the reverse direction to land in Jomsom Airport, northern Nepal. Condition of the aircraft while the aircraft was badly damaged and burned until it explodes.

Sharma said that, to date from the results of a preliminary investigation suspected the plane had technical problems. According to the current rescue teams had evacuated to nine bodies from the wreckage site. While the critical eighth victim was rushed to a nearby town that is Pokhara by helicopter. According to one police officer Nareswor Aryal, the plane was brought by two pilots and a flight attendant, who is a citizen of Nepal. The plane carrying 16 passengers and two people of Western India. Aryal said that not knowing the origin of these two strangers. The airport is the gateway to many popular destination for explorers and Hindu worshipers. They plan to travel to Muktinath shrine that had been respected. It is located 200 kilometers northwest of Kathmandu. Dornier aircraft is owned by the local air company Agri

At least 153 people were reported killed, names of victims of the crash is still in data collection

At least 153 people were reportedly killed after their plane crashed into the residential area of Lagos Nigeria, on Sunday (06/03/2012). Thick smoke billowing from the building that was hit by a plane in the area near the airport in Lagos. According to witnesses, the plane seen flying low before it crashed with a loud voice in dense residential areas. Some residents said, after the plane crashed were identified belonging Dana Airlines is Nigeria shatter and cause a fire and smoke in the housing. Wreckage strewn among the burning houses. Until now there has been a known cause of the accident. Hundreds of people flocked to the crash site to see what happens.

"The plane was owned by Dana (airline) from (the capital) Abuja to Lagos is expected to carry about 153 passengers," said civil aviation chief Harold Demuren. It is estimated that none of the passengers survived the horrific crash. "I'm not sure there is a passenger who survived," said Lagos State Police spokesman, Joseph Jaiyeoba. The plane crashed in the IJU, verges densely populated city of Lagos. "The plane flew overhead. Five minutes later there was a loud explosion. Flames and smoke rose high from the wreckage of plane in the residential population," said Tunji Dawodu, who was fresh out of the church at 15:30 o'clock local time. While the airline spokeswoman Dana, who is considered the most secure in Nigeria only confirm that one of his planes had crashed. "We can confirm that one of our planes crashed today in the outskirts of Lagos," said Tony Usidamen told AFP.

CVR Transcript Complete NTSC Sukhoi

National Transportation Safety Committee (NTSC) has finished transcribing the cockpit voice recorder (CVR) in the Sukhoi Superjet 100 that crashed on Mount Salak. NTSC is still analyzing the transcripts of one of the two components of the black box. "I transcribed it all, the analysis is in progress. We are assisted by a translator from the Embassy in Uzbekhistan and Sukhoi team," said Chairman of the NTSC Tatang Kurniadi a news conference at Halim airport, Jakarta, Thursday (31/05/2012).

Tatang said the contents of the CVR was the pilot talks along with crews that are in Sukhoi aircraft. "Records of the conversation in the cockpit. Also there is a flight attendant voice. For that later," he concluded. As known, the plane's black box there are two components of the CVR and Flight Data Recorder (FDR). CVR was found Tuesday (15/5), while the new FDR was found on Wednesday (30/5) night. FDR was found 20 meters from the tail. Sukhoi falls on May 9. 45 people died in the crash.

FDR was found, the scene on Mount Salak Sukhoi Still Closed to Public

Most of the region of Mount Salak is still closed to the public even though the evacuation was stopped after the discovery of FDR. This is done so that people do not take the alleged aircraft debris was strewn lot at Mount Salak. "Although FDR has been found, the area where the crash is still closed to the surrounding communities. Only the people who will visit the tomb located in the vicinity should be allowed to enter. This is to prevent people do not take the goods or part of the plane to the property yesterday brought the aircraft control levers and the compressor should be submitted NTSC but instead brought to the RS police, "said Chief Marshal Basarnas Daryatmo at Halim Perdanakusumah Airport, Jakarta, Thursday (05/31/2012).

Meanwhile 061/Suryakancana Military Commander Colonel Infantry AM Putranto said the closure was done in order not to be used by people who do not berkepetingan. Putranto appealed to people to report or give up if they find pieces of Sukhoi aircraft at Gunung Salak. "I added to Mount Salak closed unless other activities are not being utilized to adjust so that unauthorized persons. I appealed to the residents around Mount Salak so do not ever take that instead of his interests. In general if there will be people who find the pieces of the Sukhoi aircraft or another property is expected to return to the officer who was dis ana or to the local police station, "imbaunya.

Sukhoi Not to Define and Find the amount of Insurance for Victims

How Moscow compensation given to victims of plane crash on Mount Salak May 9, has not been determined. Thus the statement in the Russian manufacturer Sukhoi. The statement followed reports in the mass media in Indonesia called the families of the victims will receive compensation of Rp 1.25 billion (145 thousand dollars). Manufacturer Sukhoi said the new party next week to collect the documents from the family of the victim and the accident investigation will be continued.

As reported by Russian media, rbc.ru, published June 1, 2012. Mentioned, the Sukhoi Superjet 100 plane that crashed had been insured. Coverage to third parties - including the crew and passengers - reached 300 million dollars. As reported previously, Sukhoi agent in Indonesia, PT Trimarga Rekatama, Sukhoi lobbied to be willing to comply with the provisions Permenhub that the death toll from a plane crash are entitled to receive compensation of Rp 1.25 billion. Meanwhile, the government of Indonesia through Raharja Services provide compensation of Rp 50 million / victims as a form of humanity.

SIMULATION OF THE JAVA SEA USING AN OCEANIC GENERAL CIRCULATION MODEL

The Hybrid Coordinate Ocean Model (HYCOM) is used to simulate the Java Sea mean sea
level, surface current and volume transport. The model (JSD, Java Sea Domain) is driven
by the European Remote Sensing (ERS) satellite-derived and National Center
Environmental Prediction (NCEP) wind stresses. The ERS-derived and NCEP wind
speeds and stresses are compared to investigate the impacts of the different wind
forcing data on the estimation of the Java mean sea level. The validation results illustrate
that the simulated mean sea levels agree well with the tide gauge sea levels. The
NCEP wind-driven JSD (called NJSD) model has correlation coefficients from 0.53 to 0.84
and root mean square errors (RMSE) of 47 mm to 76 mm. On the other hand, the ERS
wind-driven JSD (Called EJSD) model has the correlation coefficients from 0.71 to 0.89
and RMSEs of 40 mm to 61 mm against tide gauge sea level, respectively. These
validation results reveal that accuracy of the EJSD model is better than the NJSD
model.
The relationship between the Java Sea zonal wind and volume transport is also
investigated by using HYCOM. Due to the shallowness of the Java Sea, the volume
transport is dominated by the wind, which is greatly different between ERS and NCEP.
The Java Sea volume transport is directed eastward and westward during the
northwest (October to March) and southeast (April to September) monsoons,
respectively. The westerly and easterly ERS wind stresses in December and August are
0.01 N/m
2
and 0.03 N/m
2
higher than NCEP wind stresses, respectively. Moreover, the
NCEP mean wind speed is 1.0 m/s and 2.5 m/s lower than ERS mean wind speed, during
the northwest and southeast monsoons, respectively. Consequently, the Java Sea
eastward volume transport simulated by the EJSD model is found to be larger than the
one simulated by the NJSD model. The EJSD model-simulated Java Sea eastward and
westward volume transports in December and August are 0.23 Sv and 0.30 Sv larger than
the ones simulated by the NJDS model, respectively.
Key words: Java Sea, ERS wind, NCEP wind, HYCOM. INTRODUCTION
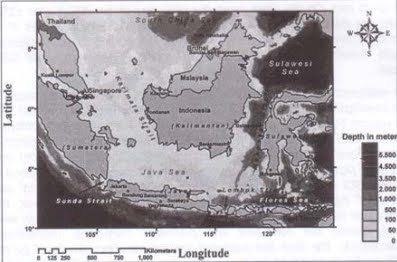
The location of the Java Sea and the Makassar Strait is depicted in Figure 1. The
Java Sea has average depths from 40 m to 50 m. The Java Sea is bordered by the
Kalimantan Island to the north, the Java Island on the south, the Sumatra Island on the
west, the southern Makassar Strait on the east, the Karimata Strait on the northwest, and
the Sunda Straits on the southwest.
Many studies on the Indonesian troughflow (ITF) have been conducted through the
Arlindo (Arus Lintas Indonesia, [1,2,3]) project and others. Unfortunately, most of the
scientists neglected what was happening in the Java Sea due to its shallowness [4]. The
past observation [5] and NCEP wind-driven ocean model results [6,7] show that the Java
Sea low-salinity surface water shifts into the southern Makassar Strait during the
northwest monsoon from October to March. The southeast monsoon winds return the lowsalinity water back into the Java Sea during the southeast monsoon from April to
September. Sofian et al. [6] also argue that the strong westward volume transport
generates high sea level within the Java Sea. Moreover, the Java Sea transport is directed
eastward during the northwest monsoon, from October to March, and to the westward
during the southeast monsoon from April to September, following the monsoonal wind-indivvidu
Figure 1: Bathymetric map of the Indonesian Sea, including the Sunda, and
Karimata Straits, the South China Sea, the Java Sea, the Makassar Strait, the
Flores Sea, and the Sulawesi sea.
The aim of this study is to investigate the impacts of different wind forcing data on
the simulation accuracy of the Java Sea. The models are forced by the ERS and NCEP
winds. The ERS wind has a limitation on the period of data, which is only available from
1992 to 2001, while the NCEP wind is available from January 1948 to the present.
However, the NCEP wind has the limitation on the spatial resolution of 1.875° longitude
yxJ latitude, while the ERS wind has the spatial resolution of 1° longitude and latitude. '-e
present study addresses the following questions: 1) how good is the modelled mean sea
level against the tide gauge mean sea level?, 2) are the modelled mean sea levels eiable
to express the El Nino Southern Oscillation (ENSO) impacts on the mean sea evel?, and
3) can the different wind forcing change the Java Sea volume transport?
This paper is organized as follows. The brief explanation of data used in this earch and
the model configuration are given in the section of Ocean Model. The Description of tide
gauge mean sea level data and results of model validation are described in the section of
Model Validation. The wind patterns and the climatology over the Java Sea are described
in the section of Wind Climatology. The relationship between wind and -xxJelled surface
current during the northwest and southeast monsoons are discussed in ne section of
Wind and Surface Currents. The climatology of the Java Sea volume transport is
described in the section of Java Sea Volume Transport. The final section is -stained to
concluding remarks. Ocean Model
HYbrid Coordinate Ocean Model (HYCOM) [8] is applied to simulate the Java Sea
and the Makassar Strait. The model region is the Indonesian Sea including the Southern
South China Sea, the Java Sea, the Sulawesi Sea, the Karimata Strait, and the Makassar
Strait, as shown in Figure 1. The horizontal grids span from 80°E to 125°E and from 10°S
to 8°N. This domain is referred to as the Java Sea Domain (JSD) hereafter, and the grid
resolution is Mercator 0.1° longitude and latitude. The model is configured with 22
layers,and the bottom topography is based on ETOP02 data. This model uses KPP (KProfileParameterization) vertical mixing, and the explanation of the method can be found
in [9]. More detail description of the HYCOM equations and numerical algorithms can be
found in [8]. The model relaxes at the lateral boundaries to the World Ocean Atlas (WOA)
1998 monthly climatology, which contains salinity and temperature profiles. Tidal forcing is
not available in HYCOM. The model is driven by weekly ERS and NCEP wind speed and
stress data. The ERS wind data are derived from Centre ERS d'Archivage et de
Traitement -Institut francais de recherche pour I'exploitation de la mer (CERSATIFREMER [10]). The ERS wind has the spatial resolution of 1° longitude and latitude. The
atmospheric forcing that contains surface air temperature, surface specific humidity, net
shortwave and longwave radiations, and precipitation are based on the NCEP reanalysis
data. The weekly NCEP data are calculated from the daily mean data. The NCEP data
have the spatial resolution of the Gaussian grid 1.875° longitude and latitude. The model's
sea surface temperature (SST) is the National Oceanic and Atmospheric Administration
(NOAA) optimal interpolation (01) SST. The NJSD and EJSD model are nested to the
large domain model, which covers the area from 30°E to 60°W and from 45°S to 45°N.
This region is referred to as the Indo-Pacific Ocean Domain (IPD). The ERS and NCEP
wind-driven IPD models a
r
e called EIPD and NIPD models, respectively. NIPD and EIPD
models have 1° longitude nd latitude grid spacing. Moreover, the EIPD and NIPD models
use the same topography iata and parameters of the forcing fields, initial conditions, and
mixing layer model as used in the EJSD and NJSD models, respectively.
The sensible and latent heat fluxes are calculated during model runs, using the
model SST and the bulk formulae. The NJSD and EJSD models are relaxed to the NIPD
and EIPD models, respectively. The relaxation time scale increases from 0.1 to 3 days
with distance away from the boundaries. The precipitation and evaporation are also
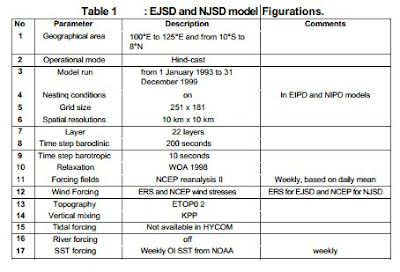
included in this model. The summary of model configurations is presented in Table 1.


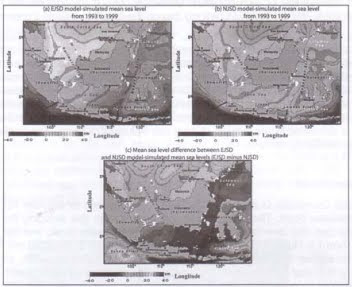
Figures 2 (a) and (b) show the EJSD and NJSD model-simulated mean sea levels for
7 years from 1993 to 1999. Figure 2 (c) shows the difference between the EJSD and NJSD
model-simulated mean sea levels. The EJSD and NJSD model-simulated mean sea levels
show similar patterns within the Indonesian Sea. The mean sea level is high at the South
China Sea and the Karimata Strait and low at the Java Sea and southern Makassar Strait.
"Tie lowest sea level is occurred at south off Java and Sumatera Islands as shown in
Rgures 2 (a) and (b). The Figure 2 (c) shows the EJSD model-simulated sea level is about
7
:m lower than the one simulated by NJSD model in the Java Sea, and reaches to 7 cm
tower at the southern Makassar Strait. Moreover, the EJSD-simulated mean sea level is 5
cm lower than NJSD-simulated sea level in the Sulawesi Sea. On the other hand, the EJSD -
nodel-simulated sea level is 5 cm to 10 cm higher than the one simulated by NJSD model
n the South China Sea and Karimata Strait.
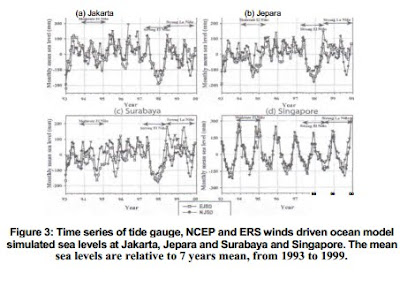
These HYCOM-estimated sea levels are validated using tide gauge sea levels. The
m-situ sea level data (1993-1999) recorded at Jakarta, Jepara (near Semarang) and
Surabaya have been obtained from the National Coordinating Agency for Surveys and
Mapping of Indonesia (Bakosurtanal). In addition the tide gauge at Singapore that derived
from University of Hawaii Sea Level Center (UHSLC) is also used to validate the simulated
mean sea levels at the Karimata Strait. Figures 3, 4 and 5 show the validation results of
simulated monthly mean sea levels. The tide gauge and HYCOM show that sea levels are
low during the El Nino periods (Figure 3). The results of validation for the BSD model
show that correlation coefficients (CC) are ranging from 0.72 to 0.89 and the root mean
square errors (RMSE) are varying from 40 mm to 61 mm (Figure 4). On the other hand,
the NJSD model-simulated mean sea level has the CC from 0.53 to 0.85 and RMSE from 47
mm to 76 mm (Figure 5). These results indicate that the accuracy of the FJSD model is
higher than NJSD model. However, only at Jakarta, the EJSD model-simulated mean sea
level has a lower CC and a higher RMSE than NJSD modelled mean sea level. This is
probably caused by the lower ERS wind speed and stress than NCEP wind speed and
stress at the northern Jakarta (refer to Figures 6 and 7).
On the other hand, according to Sofian et al. [11], the absolute dynamic topography
(ADT) derived from various altimeters [12] shows the RMSE from 40 mm to 60 mm

against the tide gauge mean sea level. This fact indicates that the accuracies of the two
models are comparable with the one derived from ADT.
The signal of ENSO can be seen in both of the model and the tide gauge data at the
Java Sea. The tide gauge and simulated sea levels abruptly increase during the transition
period from strong El Nino (1997/1998) to strong La Nina (1998/1999), though the
simulated sea levels at Jepara and Surabaya tend to be lower than tide gauge sea levels
during this period as shown in Figure 3. On the other hand, the signal of ENSO is not
clearly seen in both of the model and tide gauge at Singapore. Eventually, the EJSD model
shows a better agreement with observation than the NJSD model, in terms of higher CC
and smaller RMSE. The summary of validation results between the simulated and tide
gauge mean sea levels is depicted in Table 2.
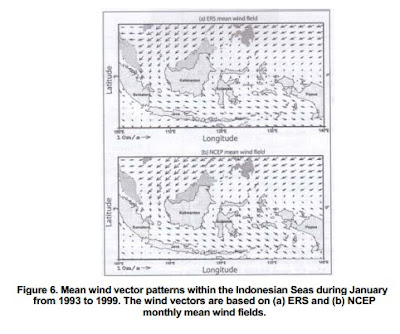
Wind Climatology
In this section, wind vector patterns in the Indonesian Sea are compared between
ERS and NCEP wind fields. The climate of the Indonesian Sea is characterized by
monsoonal winds and high rainfall. Figures 6 and 7 shows the wind vector patterns within
ne Indonesian Seas during January and August from 1993 to 1999. The mean wind vector
patterns are calculated based on monthly mean ERS and NCEP wind fields. Winds blow
*rom the south, curving across the equator with a westward component in the south, and
an eastward component in the north, from May to September, the wind direction is nearly
opposite during November to March [13]. During the southeast monsoon from May to
September, the easterly and southerly winds blow in the Java Sea and the Makassar Strait,
respectively. On the other hand, during the northwest monsoon from November to March,
wind direction over the Java Sea and Makassar Strait change to westerly and northerly,
respectively. In other words, the Java Sea is dominated by the zonal wind throughout the
year.
Figures 8 show the ERS and NCEP-derived Java Sea zonal winds (JZW) and wind
stresses (JZS). Assuming that the entire JZW and JZS are homogeneous, the JZW and
JZS are defined as the average zonal wind and wind stress from 105°E to 115°E and from
7.5°S to 2.5°S. The 7 years means of ERS and NCEP-derived JZW are -1.5 m/s and -0.6
s, respectively. Moreover, the 7 years means of ERS and NCEP-derived JZS are -0.015
N/m
2
and -0.003 N/m
2
, respectively. These indicate the JZS tends to be easterly.
The JZW and JZS follow the monsoon seasons. The strongest westerly JZW westerly
JZS) and easterly JZW (easterly JZS) occur during January and August, respectively. The
westerly ERS JZW is 1.0 m/s higher than the NCEP JZW in December to January. On the
other hand, the easterly ERS JZW is 2.5 m/s higher than the NCEP JZW, n August.
Similarly, the westerly and easterly ERS JZS are 0.01 N/m
2
and 0.03 N/m
2
higher than
NCEP JZS, in December to January and August, respectively. These differences n wind
speed and stress can lead to the different surface currents in the Java Sea and the
Makassar Strait, which will be discussed in the following sections.
Wind and Surface Current
Figures 9 and 10 show the surface currents based on the EJSD and NJSD models
in January (northwest monsoon) and August (southeast monsoon). Generally, the EJSD
model-simulated surface current speeds at the Java Sea are 5 cm/s to 10 cm/s faster than
NJSD model-simulated one both in January and August. During the northwest monsoon,
as the northwesterly wind blows, the monsoonal wind expels the Java Sea water to
eastward and the Karimata Strait water to the south. The Sunda Strait surface current is
eastward and enters from the Indian Ocean to the Java Sea during this period. Conversely,
the wind direction is changed to southeasterly during the southeast monsoon. The winddriven westward current drives the Java Sea and the Karimata Strait surface waters
westward and northward, respectively. The Sunda Strait surface water exits from the Java
Sea to the Indian Ocean during the southeast monsoon.
The Makassar Strait current does not follow the monsoonal wind direction. The
Makassar Strait surface currents tend to flow southward throughout the year. The
southward Makassar Strait surface current speed is low during the northwest monsoon
period, though the northerly wind is intensive. The low southward Makassar Strait surface
current speed seems to be inhibited by the strong Java Sea eastward current. On the other
hand, the southward Makassar Strait surface current speed is getting faster during the
southeast monsoon. It is known that, the strong southward Makassar Strait surface current
pushes the surface water with low salinity and low temperature back to the Java Sea [5].


Java Sea Volume Transport
In this section, the Java Sea volume transports are compared between the
EJSD and NJSD. The Java Sea volume transport is determined from the
meridional cross section from 7.0°S to 3.5°S at 114.0°E. The time series of the
Java Sea volume transports from January 1993 to December 1999 is depicted in
Figure 11. The positive volume transport ndicates the eastward volume transport.
In general, the Java Sea transport is directed eastward during the northwest
monsoon, and to the westward during the southeast monsoon, following the
monsoonal wind-induced surface current.
Figure 12 shows the climatology of the Java Sea volume transport. The
positive and negative volume transport indicates the eastward and westward
volume transports, respectively. Generally, the EJSD model-simulated volume
transport is larger than the one simulated by the NJSD model. The eastward and
westward EJSD model-simulated volume transports in August and December are
0.30 Sv (1 Sv = 1 million m
3
/s) and 0.23 Sv larger than the ones simulated by NJSD
model, respectively. The larger ERS than NCEP-derived wind stress (refer to
Figures) causes the larger EJSD than NJSD model-simulated volume transport in
August and December, respectively. The EJSD and NJSD model-simulated
volume transports have two peaks. The peak of the eastward EJSD and NJSD
model-simulated volume transports occur in December and January. The peak of
the westward EJSD volume transport occurs in August and reaches to -0.48 Sv,
while the NJSD model-simulated volume transport is about -0.20 Sv from June to
August.
CONCLUSIONS
The simulation of the Java Sea and Makassar Strait is conducted by using
HYCOM, which is driven by ERS and NCEP winds. The modelled mean sea levels
are validated with the tide gauge mean sea levels. The results of comparison
between the EJSD-simulated and tide gauge mean sea levels show that CC
ranges from 0.72 to 0.89, and RMSEs are from 40 mm to 61 mm. On the other
hand, the NJSD-simulated mean sea level has the CC from 0.53 to 0.84, and
RMSE from 47 mm to 76 mm. The EJSD model shows a better agreement with
observation than the NJSD model, in terms of higher CC and smaller RMSE. The
accuracy of the HYCOM modelled mean sea level is found to be comparable to that
of altimeter-derived ADT. The signal of ENSO can be seen in both of the model
and the tide gauge data within the Java Sea. The tide gauge and simulated sea
levels abruptly ncrease during the transition period from strong El Nino
(1997/1998) to strong La Nina 1998/1999), though the simulated sea levels at
Jepara and Surabaya tend to be lower than tide gauge sea levels during this
period.
Due to the shallowness of the Java Sea, the volume transport is dominated
by the wind. The westerly and easterly ERS wind stresses are 0.01 N/m
2
and 0.03
N/m
2
higher tnan NCEP wind stresses, in December and August, respectively.
Moreover, the ERS mean .vind speed is 1.0 m/s and 2.5 m/s higher than NCEP
mean wind speed, during the -orthwest and southeast monsoons, respectively.
The model results indicate that the Java Sea eastward volume transport simulated
by the EJSD model is larger than the one simulated by the NJSD model. The
EJSD model-simulated Java Sea eastward and
westward volume transports are 0.23 Sv and 0.30 Sv larger than the ones
simulated by the NJDS in December and August, respectively.
Acknowledgement
We thank HYCOM consortium to provide the HYCOM code. The ERS wind
data are provided by IFREMER. NCEP wind data are provided by NOAA CDC.