Remote Sensing and GIS for Vegetation Index

Remote sensing has the ability to generate the geometric arrangement of spatial data close to the true state of the earth's surface in large numbers and fast. This situation requires a management system and appropriate data handling and efficient so that spatial information from remote sensing images obtained can be useful for a broad interest. Remote sensing is never separated from the Geographic Information System (GIS). The spatial data of remote sensing is one of the basic data used in GIS analysis. In the development of GIS data is also useful in the processing of remote sensing data (Barus and Wiradisastra, 2000). GIS is very good in the process of data management, both spatial data attributes and data. Integration of spatial data and attribute data in a computerized system that is referenced geographic advantages of GIS. Remote sensing data is a reflection of the results of data objects of different wavelengths that were captured by a sensor and convert it into numerical data and can be viewed in graphical form or image (imaginery) (Purwadhi, 2001). While the utilization of remote sensing data performed as it is available in large quantities, can show a very wide strip, is available for areas difficult to reach, available for a fast, and can show an object that does not appear in the form of a recognizable object (Sutanto , 1989). One example is the application of remote sensing data to see the vegetation index and estimate the amount of absorption Carbon Dioxide (CO2) by plants. NDVI (Normalized Difference Vegetation Index) is a method frequently used to exploit spectral data of vegetation index (Spectral Vegetation Index (SVI)) from remote sensing. Spectral vegetation indices from remote sensing data are formed because of differences in wave reflection from the leaves of living plants with other objects on the surface of the earth on the green wavelength (visible) and near infrared (invisible) (Horning, 2004)
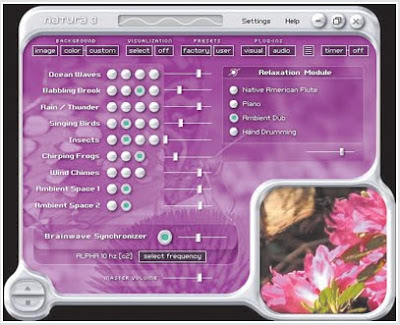
The ability of an image (imaginery) capture and display any information from the earth's surface depends on the spatial resolution, temporal resolution, radiometric resolution and spectral resolution (Purwadhi, 2001). Each image type has a type different resolutions both spatial resolution, temporal resolution, radiometric resolution and spectral resolution, resulting in the ability of an image capture and display information is also different. This objec also occur on the ability of image capture and display the information in the vegetation index.
Pictured above is an example of an image where the image shown is the distribution of vegetation is supported by the view from IKONOS imagery. and underneath the picture is the color distribution of vegetation index that is processed through GIS program2. Processing of remote sensing data by using GIS is expected to provide information quickly and precisely so that it can be used as soon as possible for purposes of analysis and data manipulation.

COASTAL AREA MANAGEMENT PLAN TO USE INFORMATION SYSTEM SENSING DATA GEOGRAPHY AND AWAY

Indonesian archipelago with the number reaching 17 508 islands and long coastline of approximately 81,000 km (DKP, 2008). This situation causes a mainstay of coastal income to Indonesian society. In the presence of the world's largest mangrove forest, coral reefs, exotic seaweed is spread in almost all the beaches, which are invaluable sources of many fisheries and the state of relatively fertile land for agriculture led to pressure for greater pesisr region. Pesisr region is also the most densely populated areas. Approximately 140 million people or 60% of the population living in the region of coastal Indonesia (DKP, 2008). Apart from the human factors, global climate change also increase pressure on the pesisr through increasing sea levels due to global warming. Coastal zone management must be done quickly and accurately by utilizing continuous data and technology that can properly describe the coastal region. Integration of remote sensing and Geographical Information Systems (GIS) is one way to manage wilyah pesisr with continuous data and spatial distribution that can display a simple form peisisir region. In simple integration between remote sensing and GIS can map the condition of coastal areas so as to monitor his condition. Remote sensing is a method for object recognition and determination of the surface of the earth without having to make direct contact with the object. Data can be continuously pengunderaan ajauh because it has a temporal resolution, can be used for various applications due to spectral resolution and displayed in various forms since the resolution spasilanya scale. Geographic Information System (GIS) is an information system designed to work with spatially referenced data or geographic coordinates or in other words, a GIS is a database system with specific capabilities for handling spatial referenced data (spatial) working in conjunction with a set of operations (Barus and Wiradisastra, 2000). GIS applications can be used for various purposes during the processing of data has a geographic references, meaning the data is composed of a phenomenon or object that can be presented in physical form and have a spatial location. Integration of remote sensing and GIS in coastal zone management can use the Environmental Sensitivity Index (IKL) / Environmental Sensitivity Index (ESI). Environmental Sensitivity Index values ​​represent the biological, socio-economic and socio-cultural in a specific coastal and marine areas are used as a priority in response to oil spills (NOAA, 1992). IKL in the development not only to assess the environmental sensitivity to oil spills, but also the sensitivity of coastal areas against pollutants and other pollutants from both rivers, settlements, and the activities around the coast. The vulnerability of coastal ecosystems to the impacts caused by human activity and development is highly dependent on the strength of these ecosystems withstand the changes that occur, as shown by the sensitivity of these ecosystems. The sensitivity of an ecosystem that is the picture of the strength of the ecosystem to recover as the original objec affected by the biology and ecology of these ecosystems. This is the basic theory of the determination IKL, so the results of the IKL can be used as a reference in planning and managing pesisr region. Remote sensing data can menangkapat and identify various objects in coastal areas such as sea grass, coral reefs, state of the sand, seagrass, mangrove existence, land use, and distribution of other vegetation is a coastal ecosystem. These data can be integrated with GIS data such as administrative boundaries, population, road conditions, river conditions and the topography of the land form and topography of the beach and the sea (bathymetry). While the use of the GIS data, GIS can also analyze the spatial data so as to provide other forms of spatial data previously entered will be useful in determining the value of IKL. The advantages of GIS are spatially referenced data handling kemampaunnya geography that integrates with the attribute data so that data can be analyzed keruangannya form. The results are as length, area, volume, association, classification and estimation of spatial-shaped appearance. The situation is obtained from the analysis and manipulation of spatial data which is another advantage of the SIG, as for example spatial analysis and data manipulation is done in such GIS overlay, interpolation, buffering and classification. Integration of remote sensing and GIS in a study, especially in the determination of IKL is expected to be able to streamline the time and cost with a better level of accuracy as well as continue to follow the environmental change the region's ecosystems. In addition to analyzing data, GIS is also capable of producing a thematic map that is expected pretty enough to be able to help handling and spatial mapping pesisr which one example is the Environmental Sensitivity Index of thematic maps (IKL) pesisr region. IKL map examples can be seen in the picture below

Mangrove forests in Indonesia and its range

Indonesia is a rich country, we should be proud of our country. we have the largest mangrove forest in the world, the spread of the exotic coral reefs, sea grass that lie in almost all the beaches, which are invaluable sources of many fisheries. by Rusila Noor, et al. (1999) Indonesia is a country that has the largest mangrove forest biodiversity in the world with the world's largest and most varied structures in the world. What is lacking ... try entar deh data problems we see below. Mangrove forests or mangroves commonly called, although the mention of mangroves because it does not fit exactly only mangroves is one of the species itself is kind of mangrove Rhizophora spp. Mangrove forest is a typical forest types and grows along the coast or estuaries are influenced by tides. Mangroves are often found in coastal areas are protected from the onslaught of the waves and gently sloping areas in the tropics and sub ​​tropics (FAO, 2007). According Gunarto (2004) thrives in the mangrove estuaries or estuarine area that is the ultimate goal of organic particles, or silt carried from upstream akibar erosion. Fertility of this area is also determined by the presence of tidal nutrient transporting. Based on data from Directorate General of Land Rehabilitation and Social Forestry (2001) in Gunarto (2004) Mangrove forest cover in Indonesia in 1999 is estimated at 8.60 million hectares will be but about 5:30 million hectares in damaged condition. While the FAO data (2007) Mangrove forest area in Indonesia in 2005 reached only 3,062,300 ha or 19% of the Mangrove forest in the world and the largest in the world than Australia (10%) and Brazil (7%).
In Asia alone Indonesian mangrove forest area amounted to about 49% of the total area of mangrove forests in Asia are followed by Malaysia (10%) and Mnyanmar (9%). But the estimated forest area has been reduced manrove diIndonesia about 120,000 ha from 1980 to 2005 due to changes in land use to agriculture (FAO, 2007). Data from the Ministry of Environment (MoE) RI (2008) based Direktoral General Land Rehabilitation and Social Forestry (DG RLPS), Ministry of Forestry (2000) the potential area of mangrove forests in Indonesia is 9.204.840.32 ha area of ​​2,548,209.42 ha is in good condition , was broken and damaged 4,510,456.61 2,146,174.29 ha ha. Based on 2006 data on 15 provinces are sourced from BPDAS, DG RLPS, MoF mangrove forest 4,390,756.46 ha reached. Data Center Survey mapping results of the Natural Resources of the Sea (PSSDAL)-RAN by analyzing Landsat ETM image data (image data accumulated in 2006-2009, 190 scenes), estimate the area of mangroves in Indonesia was 3,244,018.46 ha (Hartini et al. , 2010). Ministry of Forestry in 2007 also issued a data area of mangrove forests Indonesia, while Indonesia is based on extensive mangrove forests forestry ministry is 7758410.595 ha (Director of Land and Forest Rehabilitation Ministry of Forestry, 2009 in Hartini et al., 2010), but nearly 70% damaged (do not know what kind of damage category). The agency also issued a second of data per province Mangrove area in 33 provinces in Indonesia. extensive area of mangroves in the 33-province can be seen in the following table:
NASA (2010) also release information about the extensive mangrove and spreading. he vast mangrove in Indonesia has decreased by 35% between the years 1980-2000 in which the area of mangrove in 1980 it reached 4.2 million ha and in 2000 was reduced to 2 million ha. more extreme the data nieh hehehe ... tp the most important of these is any NASA data mangrove in Indonesia as seen in the image below. They also (NASA) to upload a few photos of the conversion of mangrove forests widened fields
Whatever the form of data, which clearly we have a lot of mangrove forests are reduced. Land conversion is done by humans to the mangrove forest area as a pond, agricultural and residential areas causes land area of ​​mangrove forest is declining. In addition the utilization of mangrove forests are not responsible as a building material, firewood and charcoal is also not a little contribute to the destruction of mangrove forests. As seen in the picture below mangrove forest land use change into ponds from 1992 to 1998 Mahakam delta area. According Rusila Noor, et al. (1999) is a natural mangrove mortality did not contribute significantly to the loss of mangrove areas in Indonesia.
Satellite images SPOT images covering most of the Mahakam Delta. The red color indicates vegetation cover, including mangrove forests. (a) In 1992, shrimp farms covering only 4% of the mangrove forest area. (b). In 1998, shrimp farms has destroyed 41% of mangrove forest area. (c) Inset of the region in the white striped box in Figure (b), show a growing pattern of ponds in the region (Hussein, 2006) Now we try to see its function. Melana et al. (2000) says that the function of mangrove forests are: As a place to live and forage fish, crabs, shrimp and fish where the process of reproduction Supplying food for estuarine species living area underneath for mangrove organic produce as a protective environment to protect the ecosystem of coastal erosion and tsunamis, waves, ocean currents and hurricanes as a producer of organic biomass and absorbing pollutants around the beach with the absorption and adsorption as a place of recreation, especially for the views of bird life and other wildlife as a source of wood for housing, firewood, charcoal and wooden fish traps breeding places and catching fish seed as a drug and alcohol By looking at the functionality we expect we can maintain the mangrove forests that can be enjoyed by generation after us. Mangrove forest area is not always reduced. Oriented management of mangrove forests generate income for local communities such as the utilization of natural attractions as well as strict protection by the government to increase the area of ​​mangrove forests. In the next article I will try to review the research results in an increase in mangrove forest area Tahura Ngurah Rai Bali. Which is an example of successful management of mangrove forests.

Distribution of clouds (rain) over Indonesia in real time from satellite MTSAT

given the importance of information in the cloud distribution in the time willing to Indonesia, then I try to link in this blog. information than Indonesia is one of the regions in the world who have very high rainfall variability both in time and location. therefore very important to know the current state of rainfall in this region oh yes, who is a white cloud in the picture. clouds in the image is not meant rain, but it has a chance of rain. arrangement of the image from top to bottom to inform the distribution of the cloud of an hour earlier (when you open this blog) to 25 hours in advance. hujau line is the distribution of islands in Indonesia. cloud distribution information is obtained from the Meteorological Satellite Center (MSC) of Japan Meteorological Agency (JMA). MTSAT-2 satellite is. OK survived to enjoy this dish. hopefully can be early warning (reminder) for all of us.

How to cut the image file in ArcView

As I write here, the operation called ArcView data format with BSQ, BIL, BIP, JPEG, TIFF, BMP, and GeoTIFF. A default file *. Img. klo work pake image file, the main obstacle is usually very fast hard drive is full. Well usually save the original file and to a certain tempat2 I cut his image corresponding to the location I want. In addition to saving hard drive, it is also to speed up the process that occurs dikomputer. In ArcView itself does not have a command or tool to cut image. To be able to cut the image file in ArcView try diakalin the Save Image As in the Theme menu. Tp is the origin of ngeSave Image As aja .. some properties need to be set in the Image menu analysis. And of course, must have extensions Image Analyst We try to step one by one. Enable extensions image analyst. Once the image file to be cut open (here using the example of a Landsat image), then make a file pangill or area (polygon vector form) as a deduction limit (Figure below: red boxes outline a polygon vector file that is used as a cutting limit)
Further analysis on the Image menu select properties à and Image Analysis properties dialog box will open. Extent analysis in the next box select polygon vector file that will determine the outer limits of pieces (Batas_potongan.shp) or can also write down the coordinates of the outer limits. analysis Cell sizenya select the image that we will cut (Citra_landsat.img). and most importantly Masknya Analysis, select the polygon vector file which is the limit cut (Batas_potongan.shp). Image Analysis instance properties dialog box that has been filled can be seen in the image below.
Further activate the theme image to be cropped (Citra_landsat.img). the figure below is an example of the active theme and the theme is not active.
Theme menu and click Save Image As à. Specify a new name and location penyimpanya image file. Wait a minute process, the end result will look like the image below. Good luck

SRTM Data in ArcGIS displays

SRTM data (Shuttle Radar Topographic Mission), sometimes do not immediately appear attractive when displayed in ArcGIS. SRTM display all gray look, there is no difference between one place to another as shown below.
The cause of the appearance of the SRTM data as shown above is not arranged symbology. Try performing the following steps A. Open the properties of the layer srtm_58_14.ASC (adjust the file name that you are open). Accessing the properties of the layer can be done by double-click on the layer or right-click> Properties 2. Click on the symbology tab as shown below

ArcGIS for Android

ArcGIS for Android extends the reach of your GIS from the office to the field. ArcGIS for Android includes an application that you can download from the Android Market. Using the ArcGIS Application you can explore maps available from ArcGIS Online or ArcGIS Server, open and view rich map content, collect GIS features and much more. ArcGIS for Android also includes a Runtime SDK that enables Java developers to build a focused line of GIS-enabled business applications for Android devices. Read about the ArcGIS Application ArcGIS Application The ArcGIS Application for Android has been released! You can get it on Google Play here. Using the application you will be able to: Display and navigate maps Find addresses and places Identify locations and GIS features Measure lines and areas Find and share maps from ArcGIS Online Collect GIS data Use your phones GPS Using the ArcGIS application on your Android device you can create and update GIS data in the field, discover, open and explore maps, find places and addresses, query map layers that are hosted either at ArcGIS Online or your corporate ArcGIS Server

Picture Tornado Damage in Alabama

The impact of storm damage tornado in Tuscaloosa, Alabama on 27 April 2011 can be seen from high resolution satellite imagery natural color. The following pictures are taken from satellite imagery in some places. Tuscaloosa Overview
Overview Detail
Alberta Elementary School
Charleston Square Apartments
University Place Middle School
Veterans Memorial Parkway
Note: click on image to view full size (Source: Digital Globe)

Create a polygon with coordinates

Data sources is one of the important points in the process of manufacture and processing of spatial data in ArcGIS there are many sources of data as well as the type, source data may include satellite imagery, aerial photographs, digital maps, survey results from both GPS and other survey instruments and field data collection a marker on the map the area that we will be. One source of data is the most widely used existing data from field surveys using GPS to determine location coordinates of a point, GPS is the most common tools in use in the field of geospatial both for navigation and mapping for a particular region or area, the benefits of GPS is that we can determine a point of no coverage and constrained problems buying process data long enough, we just need to come on site or we will map the area and take the coordinates and other data on the region. ArcGIS is a GIS software that has the advantage and the ability to load data in the form of coordinates either directly from the recording of data such as Garmin and Magellan GPS and the coordinate data of a conventional recording then enter MS Excel or notepad kedala On this tutorial we will discuss how to create a polygon from the data point that was made from the coordinates of the point made ​​in MS Excel.
data from field surveys in the form of coordinate points IUP boundary of a mining company, this tutorial will discuss the stages in performing input coordinate points on everything from how to prepare the data from MS Excel create a formula to convert coordinates formatted Degree minutes into the second coordinate Decimal format degree, then enter the data table into ArcGIS and made ​​a point-point coordinates in ArcGIS

Creating a Coordinate System TM3

TM3 Coordinate system used by the BPN for land measurement. I see many systems use these coordinates on the maps Cadastral / HGU plantation. Import GIS software by default does not include the coordinate system is in the list of existing coordinate system. Although demukian, by knowing the parameters of TM3, we can make a coordinate system with easy TM3. Here is one example of making the coordinate system of TM3 in ArcGIS software. Differences / Similarities TM3 and UTM is TM3 has a wide zone of 3 degrees, while the UTM zone has a width of 6 Degrees. A UTM zone is divided into two zones TM3. MisalnyaUTM Zone 50 Zone is divided into TM3 and TM3 50.1 50.2 Zone UTM projection TM3 and both use a Transverse Mercator False Easting of each zone in TM3 is 200000, whereas at UTM is 500 000 False Northing each zone in TM3 is 1.5 million, while at UTM is 10 million Central meridian at different TM3 UTM. But the principle is the same. UTM zones dibagia two, meridian in each zone is divided into Central meridian is automatically Scale Factor in TM3 is 0.9999 while the UTM is 0.9996 Latitude of Origin at the 0 (zero) degrees Parameters can be downloaded at TM3.xls TM3 Armed with TM3 parameter table in the Excel file above, next we will try to make the coordinate system TM3 50.1 Zone (South Kalimantan). For other areas please use the same way but the parameters differ according to the TM3.xls file. A. Open Window "Spatial Reference Properties'. One way is by Double Click on the layer (data frame)> Coordinate System

SRTM - Creating pseudo 3D with ArcMap

Here is one example of the use of SRTM with ArcMap to display pseudo-3D maps (not real 3D). From the pictures it appears there was a dramatic shadow effects that add to the existing topography.
Here are the steps A. Prepare ArcMap, open the SRTM raster data that has been projected 2. Create a data Hillshade Data hillshade is the intensity of land receives sunlight coming at an angle and azimuth are determined. Click on the menu Spatial Analyst> Surface Analyst> Hillshade Azimuth: the direction of the sun Altitude: the angle of the sun from the horizon If you are not sure of the azimuth and altitude, let alone all by default 3. Set Transparency Hillshade Effect Activate toolbar by right click on any toolbar. Can also be accessed via the menu Tools> Customize Set the transparency of data Hillshade to 30 (eg) 4. Set the layer symbologi SRTM (elevation) for example, with gradations from green (lowlands) to red (high plains)
4. The order of layer arrangement Place the top layer Hillshade more than SRTM data (of the level) Add the SHP roads, rivers, settlements, and annotation Adjust the transparency layer and symbology layer Hillshade SRTM (elevation) to get maximum results Picture examples of layer arrangements In the ArcMap display was produced as if no shadow effect (3D) without having to use ArcScene and heat the CPU

ArcGIS 3D Analyst

Overview ArcGIS 3D Analyst provides advanced visualization, analysis, and surface generation tools. Using ArcGIS 3D Analyst, you can view large sets of data in three dimensions from multiple viewpoints, query a surface, and create a realistic perspective image that drapes raster and vector data over a surface. With ArcGIS 3D Analyst, you can Analyze terrain data to determine what can be seen from different observation points. Model subsurface features such as wells, mines, groundwater, and underground networks and facilities. View and analyze impact zones from blasts and military threats. Determine optimum facility placement or resource location. Share 3D views, animations, and analyses with stakeholders and decision makers. Create a 3D virtual city to support planning and maintenance. Who Benefits from 3D GIS A 3D perspective creates a realistic simulation of a project, environment, or critical situation to help a variety of clients plan and prepare for and proactively mitigate potential issues. City planners and developers can visualize the impact of proposed projects and share insights with community stakeholders. Mining and geoscientists can examine subsurface structures and calculate volumes. Facility managers can create and maintain building, infrastructure, and utility networks. Civil engineers can perform line-of-sight and shadow analyses for buildings, cell towers, and utility infrastructure. Police and security personnel gain more complete situational awareness. Military personnel can perform realistic mission and flight path analyses of potential threats.

Natura Sound Therapy Review

It has long, scientists are researching the existence of the relationship between sound waves and the human subconscious. The music and sounds are believed to affect the health, intelligence, mentality, and our concentration.
As from the 9th century, Al-Farabi has revealed the effects of music therapy for the soul listeners in the scientific literature "Meanings of the Intellect". Various research was also conducted to date, including those that gave birth to the theory of "Mozart effect (classical music)" which is beneficial for infant brain development. However, adults also have the opportunity to feel the benefits of music therapy. In addition to healing, this therapy is useful as an aid to relaxation: reducing stress, melelapkan sleep, and so forth. To menjajalnya, please download the application Natura Sound Therapy. In the Natura Sound Therapy, your music collection stored on a variety of sound effects that play and feel of the outdoors. Several options exist, such as the crash of waves, birds singing, and the flow of water. There is also a module that contains the relaxation oscillation noise American flute, piano, ambient rhythms, and hand percussion. You can play all the music and effects simultaneously or select the desired course. The volume of each sound can be adjusted and set a more dominant. If the lazy choice, select only one of 38 titles with the effects of combination therapy presets each. There are presets for the refreshment of the brain, stress release, trigger creativity, as well as bedtime. To sharpen the benefits of music therapy, Natura Sound Therapy offers a Brainwave Synchronizer. This feature is claimed to improve mental focus and prepare for the state of meditation and relaxation. But, this new function is useful if you are wearing headphones. *** Natura Sound Therapy offers an alternative way to help the healing, relaxation, and meditation. You may believe the effects may not like this music therapy. But, trying first what's wrong, anyway? Specification Trial types (7 days), the license price of U.S. $ 29.99 Installer size 48.6 MB Download site http://www.opticalsweets.com/ Operating System Windows XP/Vista/7 Plus: More sound effects are quite varied; Ease of personalization and sound effect settings. Minus: The module contains four free relaxation music selection: Size of visualization can not be enlarged; price is relatively expensive.

Review Nutrition Facts

Of all the food you eat every day, did you ever calculate how much nutrition into our bodies, from the amount of calories, fat, carbohydrate, protein, cholesterol levels, to vitamins?]
It was rare among us who observe. In fact, to maintain the vitality of the body and prevent diseases, such things should be more attention. For example, the number of calories in should equal or not too much different with out the calories while doing everyday activities. If not balanced, it is possible our bodies would appear excessive calories and fat that is harmful to health. How do we know the calorie content in foods? One way to read the nutrition facts table (nutrition facts). This table is generally printed on food packaging. But, if not, the application can be a guide Nutrition Facts alternatives. In a statement on its website, Nutrition Facts 7519 contains a list of nutrition facts of various kinds of food. Remarkably, all provided by Michael Silver (application developers) for free. To find the nutritional content of food, you just type in the name of the food in the search field. Data shown is very comprehensive, ranging from general to detailed nutrition such as vitamins, minerals, and fatty acids. One type of food may consist of several different types, such as rice (nasi) are available in a choice of "rice, brown" and "rice, white". More specific classification is also available, among others, include how to cook and salt content. Details like this is important for people who are on a diet program or are reducing the intake of salt / sugar. It is noteworthy, data and keyword search in this application is entirely in English. Because it was developed in the U.S., the list refers to any food ingredients commonly found in the menu there so do not expect to find local specialties Indonesia. *** Concerned about nutrition into the body is not only important for the "sick", but also for people who feel healthy. Nutrition Facts may be one of the guides to find out the nutritional content of the materials in the food you eat. Specification Free Types Installer size 8.07 MB Download site http://silvertriad.com/nutrition-facts/ Operating system Windows 98/ME/2000/XP/Server 2003/Vista/7 Plus: The application is simple; search results appear quickly, very complete nutritional data. Minus: List of foods that most menus are in the U.S.; Unable to add / edit the data manually.

Review My cholesterol

Coronary heart disease - according to the WHO - is the number one killer in the world, also in Indonesia. One of the factors that cause a person suffering from this disease is a narrowing of blood vessels. As a result, the flow of blood being pumped can not work optimally so that interfere with heart function.
Constriction of blood vessels due to an imbalance of the main levels of good cholesterol (HDL - High Density Lipoprotein), bad cholesterol (LDL - Low Density Lipoprotein), and fats in the blood trigiliserida. Accompanied by low HDL and high LDL triglycerides could potentially clog the arteries that carry blood to the heart. Therefore, cholesterol levels should continue to be considered. As a tool to control the balance of cholesterol in the body, Cholesterol My application could be an option. Once installed, this application will prompt you to enter the record levels of total cholesterol, HDL, LDL, and triglycerides in units of millimoles per liter of blood. This figure is obtained from medical reports that you've done or blood check engine housing. Recent data input you can do anytime. Later, all data will be stored in a database for My Cholesterol is then displayed in a table or graph format. Report the results of this recording you can also print, including the graphics. This application also has a reminder feature with an adjustable frequency. By default, My Cholesterol will run behind the scenes. Another feature that belongs to your My Cholesterol is the creation of Groups and Categories. Both are made to group the records based on criteria such as the data is entered only in between two dates, only certain hours, and contains specific katakata in his notes. *** My Cholesterol useful to record the results of checking cholesterol levels in blood and informative displays them in graphical form. The goal is to help you avoid the danger of coronary heart disease. Specification Trial types (15 days), the license price of U.S. $ 29.95 Installer size 2.66 MB Download site http://www.my-health-software.com/view/apps/my-cholesterol Operating System Windows XP/Vista/7 Plus: The interface enables users; There is a reminder function for new data input; can print a report listing levels of cholesterol.

Earthquake 3D Review

You remember the earthquake in Aceh and Yogyakarta are very powerful and takes many lives as well as an invaluable treasure. Natural disasters of earthquakes are inevitable, but still can be predicted that the possibility of damage and the resulting loss can be minimized.
There is one application that can display information about the catastrophic earthquake that could hold onto. 3D Earthquake her name. This application is small and can be run directly without installation. But do not underestimate his ability. Earthquake 3D capable displays accurate information on the incidence of earthquakes that occurred from around the world. In addition, the application is also able to predict earthquakes up to 7 days. The main page displays a 3D Earthquake earth quake and its appearance, in some desired way. Zoom in or rotate the earth can be done by this application. Information obtained about the earthquake near real time as it uses the latest data from the USGS via the internet connection. USGS stands for United States Geological Survey or the United States Geological Survey. USGS is a fact-finding research organization in charge of studying and analyzing the events of natural disasters. Using an Internet connection, you can find out the earthquake that occurred around the world in realtime. Now just click the button, then this application will be directly connected based on accurate information and data. The quake was detected starting from the smallest to the large scale. **** Earthquakes can happen anytime, especially in areas prone to earthquake Indonesia known. Earthquake 3D has applications as a guide can give early warning of potential earthquakes. Specification The type Freeware Installer size 859 kB Download site http://www.wolton.net Windows operating system 98/ME/2000/XP/Vista/2003/7 Plus: The information obtained is accurate and real-time; nuanced view three-dimensional; small file size and no installation.

GIS in health sector

GIS in the health field is the analysis of the relationship between the environment and human life with the disease, nutrition and health care system to explain the reciprocal relationship in space. GIS in the health sector is also part of human geography-related aspects - aspects of the geography of the (status) and health (system) health care. In health geography studies identified a relationship between the three components related to the geography of disease, geography and the geography of health care nutrition, with analysis on a regional scale for the third pengintegarsian approach. But in health geography, there are two fast-growing sub-discipline of geography is the geography of disease and health services. Geography of the disease include exploration, description and modeling of space-time on the incidence of disease, with regard to environmental issues, detection and cluster analysis and the pattern of spread of disease, analysis of cause - effect and the formulation of a hypothesis - a new hypothesis about the cause of the disease. Geography plays an important role in disease surveillance, health interventions, and disease prevention strategies. An example of the spread of disease in an area and whether there are effects of the condition of the area, TB, Polio, and for other diseases. Geography of the health care system, with regard to planning, management and assurance services to fit the needs, formulate public health needs are served and the pattern of the area served by health officials. Research on the geography of health services to identify gaps in health services between regions and the other one and the allocation of limited resources. As an example of allocating power to the area - an area in need and help the placement of new health facilities and expansion of existing ones. Spatial analysis of disease is an important tool in epidemiological investigations. This means helping to investigate aetologi illness or environmental hazard. One example of spatial analysis of water borne disease carried kebagsaan dangendrof a German town where the Rhine-Berg beliu analyze spatial patterns of diarrheal disease and kaitanya with water supply in the city of North Rhine-berg - jerman.Penelitiannya found that the central and southern areas of the city there many cases than the northern regions. From these results, he also found a statistically significant relationship between the incidence of gastroenteritis and the number of people who have a supply of water from the soil. Besides this factor there is penggangu population movement, the number of doctors in each area and private wells. From the above examples of GIS use, whether conducted by researchers - researchers abroad and at home. We can conclude that GIS is very helpful in our work

Events Esri Southeast User Conference

April 30–May 2, 2012 Buena Vista Palace Hotel Lake Buena Vista, FL Making a Difference with GIS Join us at the Southeast User Conference where Esri staff, users, and exhibitors will show how you can leverage geospatial technology to make your business more efficient, competitive, and successful. Bring your questions and leave empowered.

Events Esri Forestry GIS Conference

Solutions and Resources for Today's Forest Management Challenges Join forestry professionals from around the world and explore how they use GIS to Hosted by the Esri Forestry Group May 1–3, 2012 Esri Headquarters Redlands, CA Calculate land values Evaluate resource assets Automate data storage and management Increase forest revenue and economic value Support and track regulatory activities This conference is a unique opportunity to learn about projects from forestry users, talk to onsite GIS specialists, participate in discussions and workshops, and explore the advantages of GIS in a setting just for foresters.

Experience the power of where in action

Experience the power of where in action July 23–27, 2012 San Diego Convention Center ArcGIS 10.1, ArcGIS Online, mobile, and cloud take center stage. Your 2012 conference experience will be unlike any you have had. You will come away smarter, more connected, and equipped to answer tough questions from senior leadership, partners, and clients in today's new business world. Get a first look at over 600 sessions in the agenda preview. This is where learning adds to the bottom line Learn how to extend the use of your Esri software to deliver positive returns across your organization. You’ll get Best Practices Select from over 900 user paper sessions. Technical Training Attend any of our 200 technical workshops. Live Demos Pick from 250 demo presentations in 10 theaters. Technology Solutions Explore 180,000 square feet of exhibits and hands-on experiences from Esri and its partners. Networking Collaborate with peers at user group meetings, in the map gallery, and at industry events. Visions of the Future Hear from Esri founder Jack Dangermond and esteemed guest speakers in the plenary session. This is where you optimize your budget Register by June 1 for a discounted rate. The earlier you register, the more you save on hotel and travel. Find out if your organization qualifies for complimentary registration through its Esri software maintenance program. Apply education and training funds toward your registration and travel costs.

How to Detect or Know The Earthquake


The quake was the most feared natural disasters. Unlike the tsunami that could be avoided by looking for higher ground. But the quake did not know such a thing. Low height of a land can not save someone from the earthquake. But the quake could have been avoided by early mendeteski the earthquake. Well ... how do I detect or know of any earthquake? You can use an application called Earthquake 3D V2.4.5. This application is able to detect or know of any earthquake of up to 7 days ahead, great right? although not 100% accurate but it never hurts to try this application for free anyway.

This application is also portable (no installation), so it can be directly used. He was able to display information about earthquakes that occurred from around the world, and the display of information is quite accurate, though not 100%.

This application is also capable of displaying the appearance of an earthquake in some way, can also zoom or rotate the earth. The information it provides close to real time as using the latest data coming from the United States Geological Survey in the U.S. via the internet

Panda Able to Detect Large Earthquake

A few minutes before the massive earthquake struck central China earlier this week, a number of giant pandas living in zoos was restless. It is possible evidence that has the ability to detect gempa.Perilaku panda panda out of the ordinary moments before an earthquake measuring 7.9 on the Richter scale was successfully filmed a British tourist who was visiting the Wolong National Nature Reserve near Chengdu which is very close to the center earthquake. "Panda-panda really look very lazy and just eat a little bamboo rod, and when disaster strikes they are assembled with each other," said Diane Etkins, the name of the tourists. Approximately 86 adult pandas living there a number of cubs survived and was evacuated to areas where conditions Shawan more bizarre baik.Perilaku before the earthquake are also shown in other animals. In 2005, it was

reported that a herd of elephants roaring and running wild ahead of the massive earthquake that triggered the tsunami in Sri Lanka and India.Menurut Diana Reiss, a professor at Hunter College, New York, USA, animals have a sensor that senses more sensitive than humans . Many animals can hear ultrasonic sound or look in the dark. Snakes are known to feel the seismic waves and elephants may be able to detect it with his foot. These abilities are very useful to survive in the wild. "Perhaps it is also important to use animals such as other natural signs to predict disasters that damage," said Reiss. However, it is still too early to say that before the earthquake panda behavior related to these capabilities.

China Researcher Uses Snake To Detect Earthquakes

The Chinese scientists said they successfully developed a method to detect earthquakes by observing the strange behavior of snakes. Through the internet video frequency related experts from the local earthquake Nanning, Guangxi Province where penebahan detect local snake.

The scientists said, that a large snake can detect earthquakes within 120 km length of the perimeter of the 5 days before the earthquake. They also pointed out, the reaction of the snakes is very odd, even going through a wall to escape.

The China Daily, the head of Nanning earthquake, Jiang Weisong says, "among all the animals on Earth, snakes are perhaps the most sensitive animals to the earthquake." He said that snake through some of the earthquake response of their behavior is very odd.

According to Jiang Weisong, that "When an earthquake is imminent, even in winter, they also will come out of the nest. If the earthquake was devastating, it will even hit the wall to save himself. "

Nanning is an area frequently hit by earthquakes, is one area among the 12 cities in China that use sophisticated equipment to detect earthquakes. And the city also has 143 fauna oversight bodies.

Weisong Jiang said, "Through a camera mounted on a nest of snakes, then in terms of detecting earthquakes we have no further improvement. This system can be used in other areas throughout China, to help our detection more accurate. "

China's frequent earthquakes. Earlier in 1976, approximately 250,000 people died in the earthquake in Tangshan. (Secret China Sources) *

How To Detect Earthquakes Animals


Some scientists have discovered how to predict earthquakes frog. In 2009, a number of frogs in L'Aquila, Italy disappeared from the local pools, three days before the big quake.

The researchers, in a report published in the International Journal of Environmental Research and Public Health, said the rocks in the crust of the Earth issued a charged particle, before the earthquake and this affects the water. Scientists estimate that frogs can detect these changes before the tectjavascript:void(0)onic plates shifted.

The team, led by Friedemann Freund from NASA and Rachel Grant from the Open University UK hope their hypothesis that it can help biologists and geologists to work together to find out how animals know the signs of the earthquake.

Frog in L'Aquila is not the only animal that is behaving strangely before the quake. Some reports mention reptiles, amphibians, and fish also behave strangely before an earthquake occurs.

In 1975, in Haicheng, China, many people who saw the snake out of the nest, one month before the city was rocked by an earthquake. Movement of the snake is weird because these animals usually sleep longer in the middle of winter, and out at the freezing temperature suicides for this cold-blooded animals.

Ms. Grant, a biologist from the Open University, observed the colony of frogs in L'Aquila as part of his research. "It's very dramatic," he said. "96 frogs disappear within three days. After that I was contacted by NASA," he added.

Scientists from the U.S. space agency is studying the chemical changes that occur when rocks in the earth experienced a big tekakan. They also were investigating whether the change is related to the mass exodus of frogs.

Friedemann Freund geophysics expert said that the rocks in the earth's crust under great pressure, removing the particles. Particles released in the air when it reaches Earth's surface into the air molecules called ions. These chemical changes can affect the dissolved organic matter in the water and makes the material is toxic to animals that live in water. The mechanism is complex and scientists say the process needs to be examined more carefully.

But Dr Grant said this is the first mechanism as "evidence earthquake" that can be felt by the animal. Dr. Freund said the attitude of these animals can be one of a number of things that can be used as evidence of the earthquake. "Once we understand all these signals and see there are four or five clues that lead to the same thing, then we can expect something to happen," says Dr. Freund told BBC Nature

Distribution analysis of energetic particles through NOAA Satellite

The analysis of energetic particles distribution using NOAA 15 satellite data was done by selecting time span about 5 days at low and high solar activities. This analysis gives information that at low solar activity condition the particle distribution from proton and electron was concentrated at north and south pole and small amount of them was distributed at equatorial regions with small fluxes of particles. At high solar activity conditions the particles

distribution reaches the equatorial regions with a high flux of particles. The solar activity enchanment at particular time can be used as reference for retracking the particles distribution at low earth orbit including predicted those distribution in a few days since solar activity enchanment occurred. This analysis is very important for placing the satellite in orbit including the operating satellite.

DATA PROCESSING SATELLITE NOAA-AVHRR SEA SURFACE TEMPERATURE FOR THE MEASUREMENT OF AVERAGE DAILY

In 2000, BRKP establish Earth Station Satellite Data Receiver NOAAAVHRR in 3 (three) locations in Indonesia in the interests of fishing activities by
the fishermen. In 2004, the French Government to provide grants to BRKP
enhance the ability of these earth stations are located in Perancak, Jembrana, Bali and
Bitung, North Sulawesi.
Increased capacity of the earth station will allow the receiver to
receives satellite data throughout Indonesia. There currently are 6 series NOAAAVHRR satellites that orbit the NOAA 12, NOAA 14, NOAA 15, NOAA 16, NOAA 17 and
NOAA 18, NOAA 18 which is the most recent satellite, launched in
dated May 20, 2005.
Each series of NOAA satellites across the territory of Indonesia about two times a day.
With the 6 series which is still orbiting NOAA satellites today, then in one day less
more will receive 12 satellite images that can be used for various purposes.
*) Research and Observation of Marine, Marine Technology Research Center, BRKP-
Ministry of Maritime Affairs and Fisheries 2
Particular interpretation of satellite data on the reflection of infrared wavelengths to
measurements of sea surface temperature requires a homogeneous target with emissivity
are known. Previous studies on sea surface temperature using satellite
Nimbus clouds using the photo as a comparison in which at a certain temperature will
detected as a cloud. The presence of clouds is of course reduces the area that could be detected
sea ​​surface temperature.
Subsequent temperature patterns can be mapped, not just on individual data daily to
small parts of the earth's surface, but also replicates the data in a particular area
to see changes. (EC Berets and LFCurtis, 1992)
Sea surface temperatures are very closely related to primary productivity and
currents. Changes in sea surface temperatures caused by wind currents, turbidity and
waves commonly called ocean dynamics. Differences in sea surface temperatures can also be
observed by remote sensing technology (F. Srihadiyanti Purwadhi, 1986)
Is an opportunity for monitoring sea surface temperatures in
study and exploitation of marine and coastal areas, where the application of remote sensing technology
for oceanography has been introduced since the last two decades. Visible satellite data
and infrared radiometer in oceanography was launched aimed at first time
in 1978 using satellite TIROS spacecraft. In addition, there are many
efforts and research to determine the parameters which allow for
used by the oceanographic community is provided with a vehicle or aircraft
satellite. (K.Beier, 1980)
Knowledge of sea surface temperature is very useful for many things
associated with other research and application utilization. Sea surface temperature
is one of the main factors driving cycle of the seasons in both the regions and sub tripis
tropical sea surface temperatures which will affect the atmospheric conditions, weather and seasons,
even the emergence of the phenomenon of El Nino and Lanina can be learned through the surface temperature
the sea. Many other things that related to the applications that can be affected by temperature
sea ​​level, including the fertility waters / marine and fisheries.
One of the major constraints the use of NOAA satellite data for monitoring the temperature
sea ​​level is limited by the wavelength used satellites where
wavelength used is sensitive to temperature changes or differences
sea ​​level but can not penetrate clouds.
Limitations in this case clearly does not penetrate clouds reduce the availability of data
continuously and complete because of the general atmosphere in the area of ​​Indonesia has
cloud cover is so high that often times with data from six satellites NOAA
received was not one that can be used to obtain the temperature information
sea ​​level.
This paper aims to provide sea surface temperature of the average
Daily sea surface temperature and distribution of marine territory of Indonesia.
Theory
NOAA satellite data analysis is performed to extract phase
sea ​​of ​​information through a series of processes according to the characteristics of satellite data
and outputs to be generated.
Satellite data received at the earth station will be stored in the format. L1b and. N10
where format is a raw data to be processed further into information
Another sea surface temperatures in particular. Stages of data processing to be done
to obtain results that can be analyzed as follows: 3
Format Conversion
NOAA satellite data processing is done using the software HRPT
Reader and ER Mapper where the processing of the original raw satellite data have
noaa.L1b will convert format in a format noaa.ers so that raw data can be read and
further processed using the software.
Conversion of NOAA satellite data into the format. Ers will generate satellite data
with 5 channel / channels / bands, where Channel 3, 4 & 5 are used to monitor temperature
sea ​​level. NOAA satellite spatial resolution is 1.1 km, or in other words each
pixels in the image represents an area of ​​1.1 km2 of data on the earth's surface.
Invert Value
Raw NOAA satellite data must be processed further so that the pixel values ​​have
accordance with the existing sea surface temperature at the time (when recording data). In
common value of pixels in the raw satellite data must be in Invert (reverse value) where value
pixels in the range of 0-255 behind a 255-0. which means for instance pixel value
object representing the cloud initially has a value 255 or white in greyscale
color mode was changed to 0 or black, and vice versa colored objects
black or pixel value 0 will be changed to be 255 or white. To object to the value
50 pixels will be changed to 205 and beyond.
Rectification
Apart from having the convert and invert, raw data should also be in rectification, where
previous raw data only has the position information matrix of pixels. With
perform rectification then each pixel will have a geographical position as
the earth's surface.
Rectification is done by using another map as a guide. Usually
in a one-time recording it will get the image to the sweep width of ± 2000 km or
about one-third of Indonesia. By using the map of Indonesia as
guide the NOAA satellite data can be plotted according to the geometry of the
Indonesia. One common problem that often occurs is the amount of cloud cover in
the islands of Indonesia that although the overall cloud cover below
20% but will be very difficult to be processed in the absence of a control point in time will
carried out rectification.
Calculation of sea surface temperature
The process is performed to obtain the Sea Surface Temperature is the
using the algorithm of sea surface temperature (in this study using the software
ER Mapper), which was introduced by Crosby & Mc Millin, where to get
sea ​​surface temperature information is used bands 4 and 5 as a band that is sensitive to
changes in sea surface temperature.
Sea Surface temperature algorithms:
SST: input1 +2702 * (input1-INPUT2) -0582
Input1: Value Band 4
Input2: Value Band 5 4
Mozaicking
Data is already in the process of rectification then the algorithm to be changed
a temperature value in units of ° C. The data obtained is still a single data
for the recording just about one-third of Indonesia and the region has not
free from clouds.
To get the data cloud coverage and better coverage area
all parts of Indonesia it is necessary to the process of merging or mozaicking
a single data with the different coverage.
Done with the process of merging with an average value of sea surface temperature
so there is no apparent alignment linement or as a result of temperature differences
contrast between two single data or lebih.proses average temperature value can be explained
simply by summing the values ​​of sea surface temperature of all single data
and divided by the amount of data used. But with the way it turned out to be simple
result in less accurate data as a result of having a single data
clouds and in total the land and divided by the amount of a single data used. Sure
The resulting values ​​are no longer pure as the average sea surface temperature due to
presence of clouds and land value in it.
Making Value Index
To avoid the error value as a result of clouds and land value
then the required value index where the data that has clouds and land value will
given the index 0 while the value given the index of sea surface temperature 1.
In the areas of cloud cover so small that the value will indeknya
average divider factor is also small, and thus the resulting average is
affected by cloud cover.
Calculating the average
By using the value index and sea surface temperature data from several
single dat then combined and then on the average to produce the data
Daily sea surface temperature with a more refined and easier to
diinterpetasi.
Average calculation is done by adding the value of sea surface temperature and
divided by the index. Value index was obtained by changing the value of land and clouds
to 0 (null) and sea surface temperature value to 1 (one). In this way,
the average value obtained pure value of sea surface temperature.
Average sea surface temperatures: Number of Total Value / Total Total Index
Number of Total Value: the sum value of all the surface temperature data
sea ​​in the mozaic
Total number of indexes: the sum of value index of the data cloud and land
the dimozaic 5
Method
The study was conducted by using remote sensing methods in a way
processing of satellite data for sea surface temperature through the stages
processing: Convert format, Invert Value, rectification, Calculation of Surface Temperature
Sea, Mozaicking, Making Value Index and average calculation.
Satellite data obtained from NOAA-AVHRR ground stations Perancak-Bali
operated by the Center for Marine Research and Observation, Department of Marine. Software that
ER Mapper is used which has the capability to process satellite data with
applying satellite data pixel calculation process.
Sea surface temperature derived from the processing of NOAA-AVHRR satellite data that
has 5 channels in the vehicle that carries it. To obtain the surface temperature
the sea lines used were 4 and 5 channels where the channel is
thermal infrared channels.
Calculation using the average index value as the divisor factor
performed to obtain daily sea surface temperature for the entire territory of Indonesia,
this is done to overcome the limitations of satellite data which can not penetrate clouds,
so that this process will be obtained with the distribution of sea surface temperatures are more subtle
Maps and eliminate cloud cover.
Data
NOAA-17 satellite data and NOAA-18 recording on 1 January 2006 was chosen
as raw data. On that date from NOAA satellite data seen the object of the island
and a coastline that could be used as a fastening point at the time of the data processing
them. Indonesia region covered by three satellite data. Indonesia recorded the western region
by NOAA-18 satellite as shown in Fig.1
Fig.1. NOAA satellite data 18 to January 1, 2006 at 14:26 AM

While the central region of Indonesia recorded by NOAA-17 satellite which covers
Kalimantan, Sulawesi, Java, Bali and Nusa east as shown on
gambar.2.
Gambar.2. NOAA satellite data 17 to January 1, 2006 at 10:12 AM

The next area of ​​eastern Indonesia recorded by NOAA-18 satellite which covers
Papua, Ambon and East Nusa Tenggara as shown in gambar.3
Gambar.3. NOAA satellite data 18 to January 1, 2006 at 12:48 AM

Results and Discussion
Gambar.4. Sea Surface Temperature data is covering the eastern part of Indonesia,
obtained by processing the satellite data NOAA-18 (gambar.3). Gambar.4. show
a high value close to 28 ° C are shown as green to yellow,
with uneven distribution of high temperatures where only scattered at the top of
Papua, which is part of the Pacific Ocean.
Processing of satellite data NOAA-17 (gambar.2) showed that high temperature
represented by the color yellow to red, visible in the Makassar Strait and the Java sea sea
range of temperatures near 30 ° C which covers the central part of the territory of Indonesia, such as
shown in gambar.5.

Gambar.5. Sea surface temperature satellite data from NOAA-17 dated 1
January 2006 at 10:12 AM
Indonesia's western region recorded by the satellite NOAA-18 (Fig.1) after
processing carried out showed that sea surface temperature high enough in the south of Java
until the temperature approached 29 ° C shown in yellow to reddish, but
Thus because of the high cloud cover caused sea surface temperature data in the
others are not detected, as shown in gambar.6.
Gambar.6. Sea surface temperature satellite data from NOAA-18 dated January 1
2006 at 14:26 AM
Of gambar.4, gambar.5, and gambar.6 looks different directions of tilt data,
where gambar.4 and gambar.6 has a leaning to the left while gambar.5
has a tilt to the right. This difference is due to the direction of the satellite across the
simultaneously in different parts of Indonesia where the past and gambar.6 gambar.4 (NOAA-18)
across Indonesia from south to north (ascending), at the time the satellite passed
simultaneously with the rotation of the earth to the right so that the earth's surface is recorded
left shift and produce a skewed left. In contrast to the gambar.5
(NOAA-17) across Indonesia is the region from the north to the south (descending)
resulting in an oblique view to the right. However, differences in appearance
does not affect the value of sea surface temperature resulting from the analysis
the data.
Fig.7. shows the distribution of sea surface temperature as if there is a temperature
sea ​​surface height in the middle like in Java, Kalimantan and Sulawesi are
shown in red and yellow colors. In fact the temperature is measured in
telalu area is not high. This occurs because of overlapping stacking (overlay)
in the region, especially between the data with the data of NOAA-17 NOAA-18 where both
Gambar.6. Sea surface temperature satellite data from NOAA-18 dated January 1
2006 at 14:26 AM
30 ° C
20 ° C 9
these data have different sea surface temperature, because it does not do the calculation
the average of the boundary between the two data lines are ultimately pseudo
make these data difficult to interpret.
Fig.7. Sea surface temperature is the average area of ​​Indonesia on 1 January 2006
without using the index value as the divisor factor

The results showed an average daily sea surface temperature on the 1
January 2006 and its distribution as shown in Fig.8. Data on
that after the merger process and the average use value index
as a divisor shows the temperature variation in the waters of Indonesia.
Fig.8. Sea surface temperature is the average area of ​​Indonesia on 1 January 2006

Sea surface temperature distribution as in gambar.4. shows the temperature variation in
Indonesia region with a temperature range between 20 ° C with up to 30 ° C in the show
in blue to low temperature and the red color for high temperatures seen
smoother and easier on the interpretation.
By entering a value index as the divisor factor as in Fig.8. then
sea ​​surface temperature daily average will be obtained more accurately where the value in
each point is not biased by cloud cover. If you do not use the index value as a factor
divider then when there is a point on sati cloud cover is relatively lower temperature
compared to sea surface temperature, the average daily temperature into this rendah.hal
of course reduces the accuracy of sea surface temperature data daily average.
conclusion
From this study it can be concluded that the surface temperature data on average daily
will be much smoother and more easily interpretable when using data on more than one
to cover the whole territory of Indonesia and the analysis using the calculation
the average index value as the divisor. In this way the data will be obtained
sea ​​surface temperature daily average for the area of ​​Indonesia with more distribution
clear and close to the real situation on the ground.